
How AI Transformed Database Debugging at Databricks

New Year, New Metrics: Evaluating AI Search in the Agentic Era (Sponsored)

Most teams pick a search provider by running a few test queries and hoping for the best – a recipe for hallucinations and unpredictable failures. This technical guide from You.com gives you access to an exact framework to evaluate AI search and retrieval.
What you’ll get:
A four-phase framework for evaluating AI search
How to build a golden set of queries that predicts real-world performance
Metrics and code for measuring accuracy
Go from “looks good” to proven quality.
Disclaimer: The details in this post have been derived from the details shared online by the Databricks Engineering Team. All credit for the technical details goes to the Databricks Engineering Team. The links to the original articles and sources are present in the references section at the end of the post. We’ve attempted to analyze the details and provide our input about them. If you find any inaccuracies or omissions, please leave a comment, and we will do our best to fix them.
Databricks is a cloud platform that helps companies manage all their data in one place. It combines the best features of data warehouses and data lakes into a lakehouse architecture, which means you can store and work with any type of data.
Recently, Databricks built an internal AI-powered agentic platform that reduced database debugging time by up to 90% across thousands of OLTP instances spanning hundreds of regions on multiple cloud platforms.
The AI agent interprets, executes, and debugs by retrieving key metrics and logs and automatically correlating signals. It makes the life of Databricks engineers easy. They can now ask questions about the health of their services in natural language without needing to reach out to on-call engineers in storage teams.
The great part was that this platform evolved from a hackathon project into a company-wide tool that unifies metrics, tooling, and expertise for managing databases at scale. In this article, we will look at how the Databricks engineering team built this platform and the challenges faced along the way.
The Pre-AI Workflow and Pain Points
In the pre-AI workflow, Databricks engineers had to manually jump between multiple tools whenever they had to debug a database problem. Here’s how the workflow ran:
Engineers would first open Grafana to examine performance metrics and charts that showed how the database was behaving over time.
Next, they would switch to Databricks’ internal dashboards to understand which client applications were running and how much workload they were generating on the database.
Engineers would then run command-line interface commands to inspect InnoDB status, which provides a detailed snapshot of MySQL’s internal state, including active transactions, I/O operations, and any deadlocks.
Finally, engineers would log into their cloud provider’s console to download slow query logs that revealed which database queries were taking an unusually long time to execute.
The first attempt to alleviate this problem was made during a company-wide hackathon, during which developers built a simple prototype that unified a few core database metrics and dashboards into a single view. The results were promising. However, before writing more code, Databricks took a research-driven approach by actually observing on-call engineers during real debugging sessions and conducting interviews to understand their challenges firsthand.
The first major problem was fragmented tooling, where each debugging tool worked in complete isolation without any integration or ability to share information with other tools. This lack of integration meant engineers had to manually piece together information from multiple disconnected sources, which made the entire debugging process slow and prone to human error.
The second major problem was that engineers spent most of their incident response time gathering context rather than actually fixing the problem. Context gathering involved figuring out what had recently changed in the system, determining what “normal” baseline behavior looked like, and tracking down other engineers who might have relevant knowledge.
The third major problem was that engineers lacked clear guidance during incidents about which mitigation actions were safe to take and which would actually be effective. Without clear runbooks or automated guidance, engineers would either spend a lot of time investigating to ensure they fully understood the situation or they would wait for senior experts to become available and tell them what to do.
Evolution Through Iteration
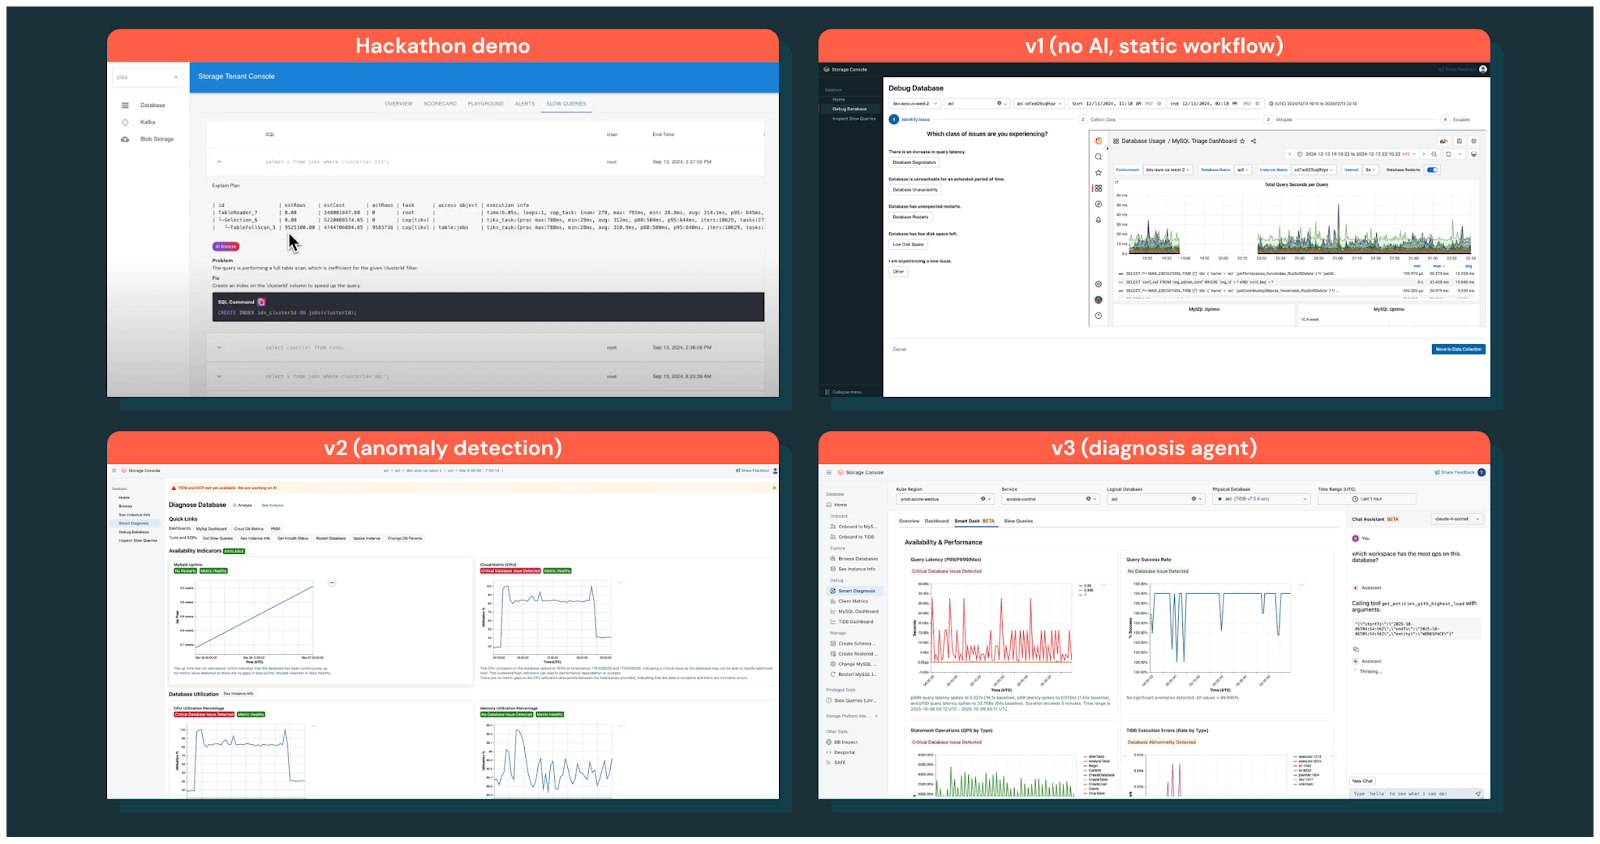
Databricks didn’t build its AI debugging platform in one shot. They went through multiple versions.
The first version they built was a static agentic workflow that simply followed a pre-written debugging Standard Operating Procedure, which is essentially a step-by-step checklist of what to do. This first version failed because engineers didn’t want to follow a manual checklist, but wanted the system to automatically analyze their situation and give them a diagnostic report with immediate insights about what was wrong.
Learning from this failure, Databricks built a second version focused on anomaly detection, which could automatically identify unusual patterns or behaviors in the database metrics. However, while the anomaly detection system successfully surfaced relevant problems, it still fell short because it only told engineers “here’s what’s wrong” without providing clear guidance on what to do next to fix those problems.
The breakthrough came with the third version, which was an interactive chat assistant that fundamentally changed how engineers could debug their databases. This chat assistant codifies expert debugging knowledge, meaning it captures the wisdom and experience of senior database engineers and makes it available to everyone through conversation. Unlike the previous versions, the chat assistant can answer follow-up questions, allowing engineers to have a back-and-forth dialogue rather than just receiving a one-time report.
This interactive nature transforms debugging from a series of isolated manual steps into a continuous, conversational process where the AI guides engineers through the entire investigation.
See the evolution journey in the diagram below:
Platform Foundation Architecture
Before the Databricks engineering team could effectively add AI to its debugging platform, it realized that it needed to build a solid architectural foundation that would make the AI integration meaningful. This was because any agent would need to handle region and cloud-specific logic.
This was a difficult problem since Databricks operates thousands of database instances across hundreds of regions, eight regulatory domains, and three clouds. The team recognized that without building this strong architectural foundation first, trying to add AI capabilities would run into unavoidable roadblocks. Some of the problems were as follows:
The first problem that would occur without this foundation is context fragmentation, where all the debugging data would be scattered across different locations, making it impossible for an AI agent to get a complete picture of what’s happening.
The second problem would be unclear governance boundaries, meaning it would be extremely difficult to ensure that the AI agent and human engineers stay within their proper permissions and don’t accidentally access or modify things they shouldn’t.
The third problem would be slow iteration loops, where inconsistent ways of doing things across different clouds and regions would make it very hard to test and improve the AI agent’s behavior.
To support this complexity, the platform is built on three core architectural principles that work together to create a unified, secure, and scalable system.
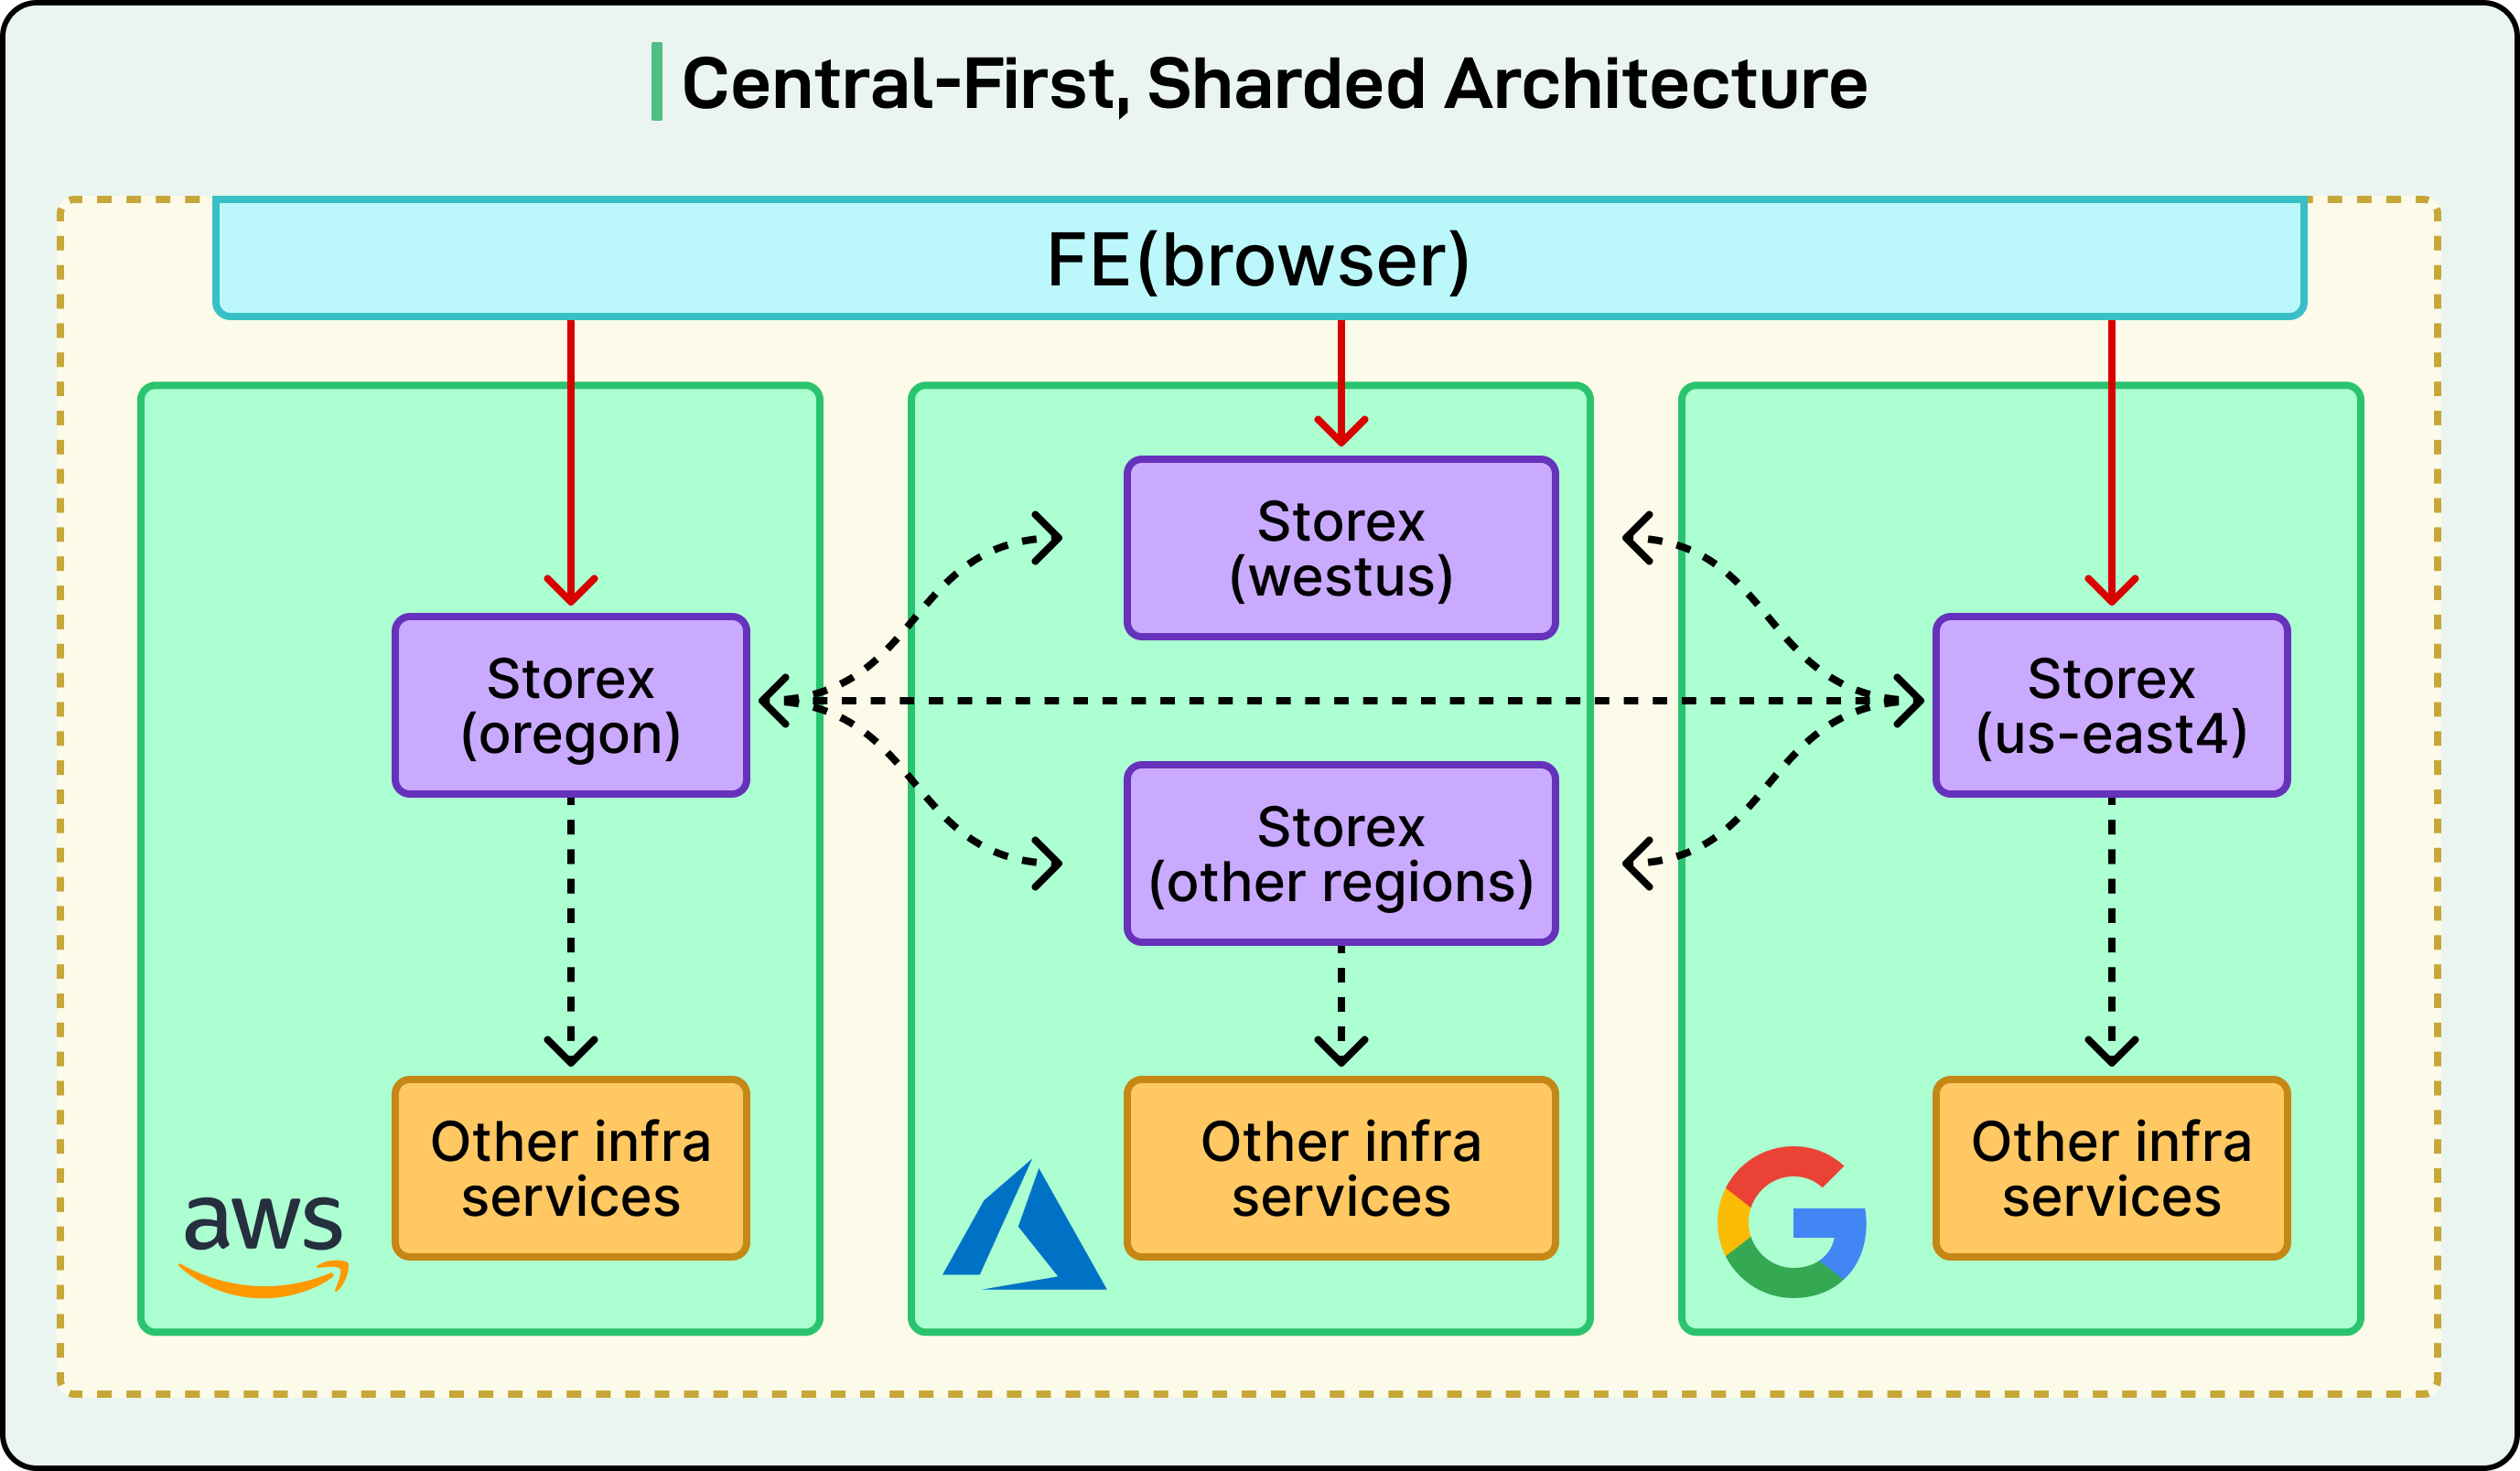
Global Storex Instance
The first principle is a central-first sharded architecture, which means there’s one central “brain” (called Storex) that coordinates many regional pieces of the system.
This global Storex instance acts like a traffic controller, providing engineers with a single unified interface to access all their databases, no matter where those databases are physically located. Even though engineers interact with one central system, the actual sensitive data stays local in each region, which is crucial for meeting privacy and regulatory requirements.
This architecture ensures compliance across eight different regulatory domains, which are different legal jurisdictions that have their own rules about where data can be stored and who can access it.
Fine-Grained Access Control
The second principle is fine-grained access control, which means the platform has very precise and detailed rules about who can do what. Access permissions are enforced at multiple levels, such as:
The Team Level: Determines which teams can access what.
The Resource Level: Determines which specific databases or systems.
The RPC Level: Determines which specific operations or function calls.
This multi-layered permission system ensures that both human engineers and AI agents only perform actions they’re authorized to do, preventing accidental or unauthorized changes.
Unified Orchestration
The third principle is unified orchestration, which means the platform brings together all the existing infrastructure services under one cohesive system.
This orchestration creates consistent abstractions, which means engineers can work with databases the same way whether they’re on AWS in Virginia, Azure in Europe, or Google Cloud in Asia. By providing these consistent abstractions, the platform eliminates the need for engineers to learn and handle cloud-specific or region-specific differences in how things work.
AI Agent Implementation
Databricks engineering team built a lightweight framework for their AI agent that was inspired by two existing technologies: MLflow’s prompt optimization tools and a system called DsPy.
The key innovation of this framework is that it decouples (separates) the prompting from the tool implementation, meaning engineers can change what the AI says without having to rewrite how the underlying tools work. Engineers define tools by writing simple Scala classes (a programming language) with function signatures that describe what the tool does, rather than having to write complex instructions for the AI. Each tool just needs a simple docstring description (a short text explanation), and the large language model can automatically figure out three important things: what format of input the tool needs, what structure the output will have, and how to interpret the results.
See the diagram below:
This design enables rapid iteration, meaning engineers can quickly experiment with different prompts and swap tools in and out without having to modify the underlying infrastructure that handles parsing data, connecting to the LLM, or managing the conversation state.
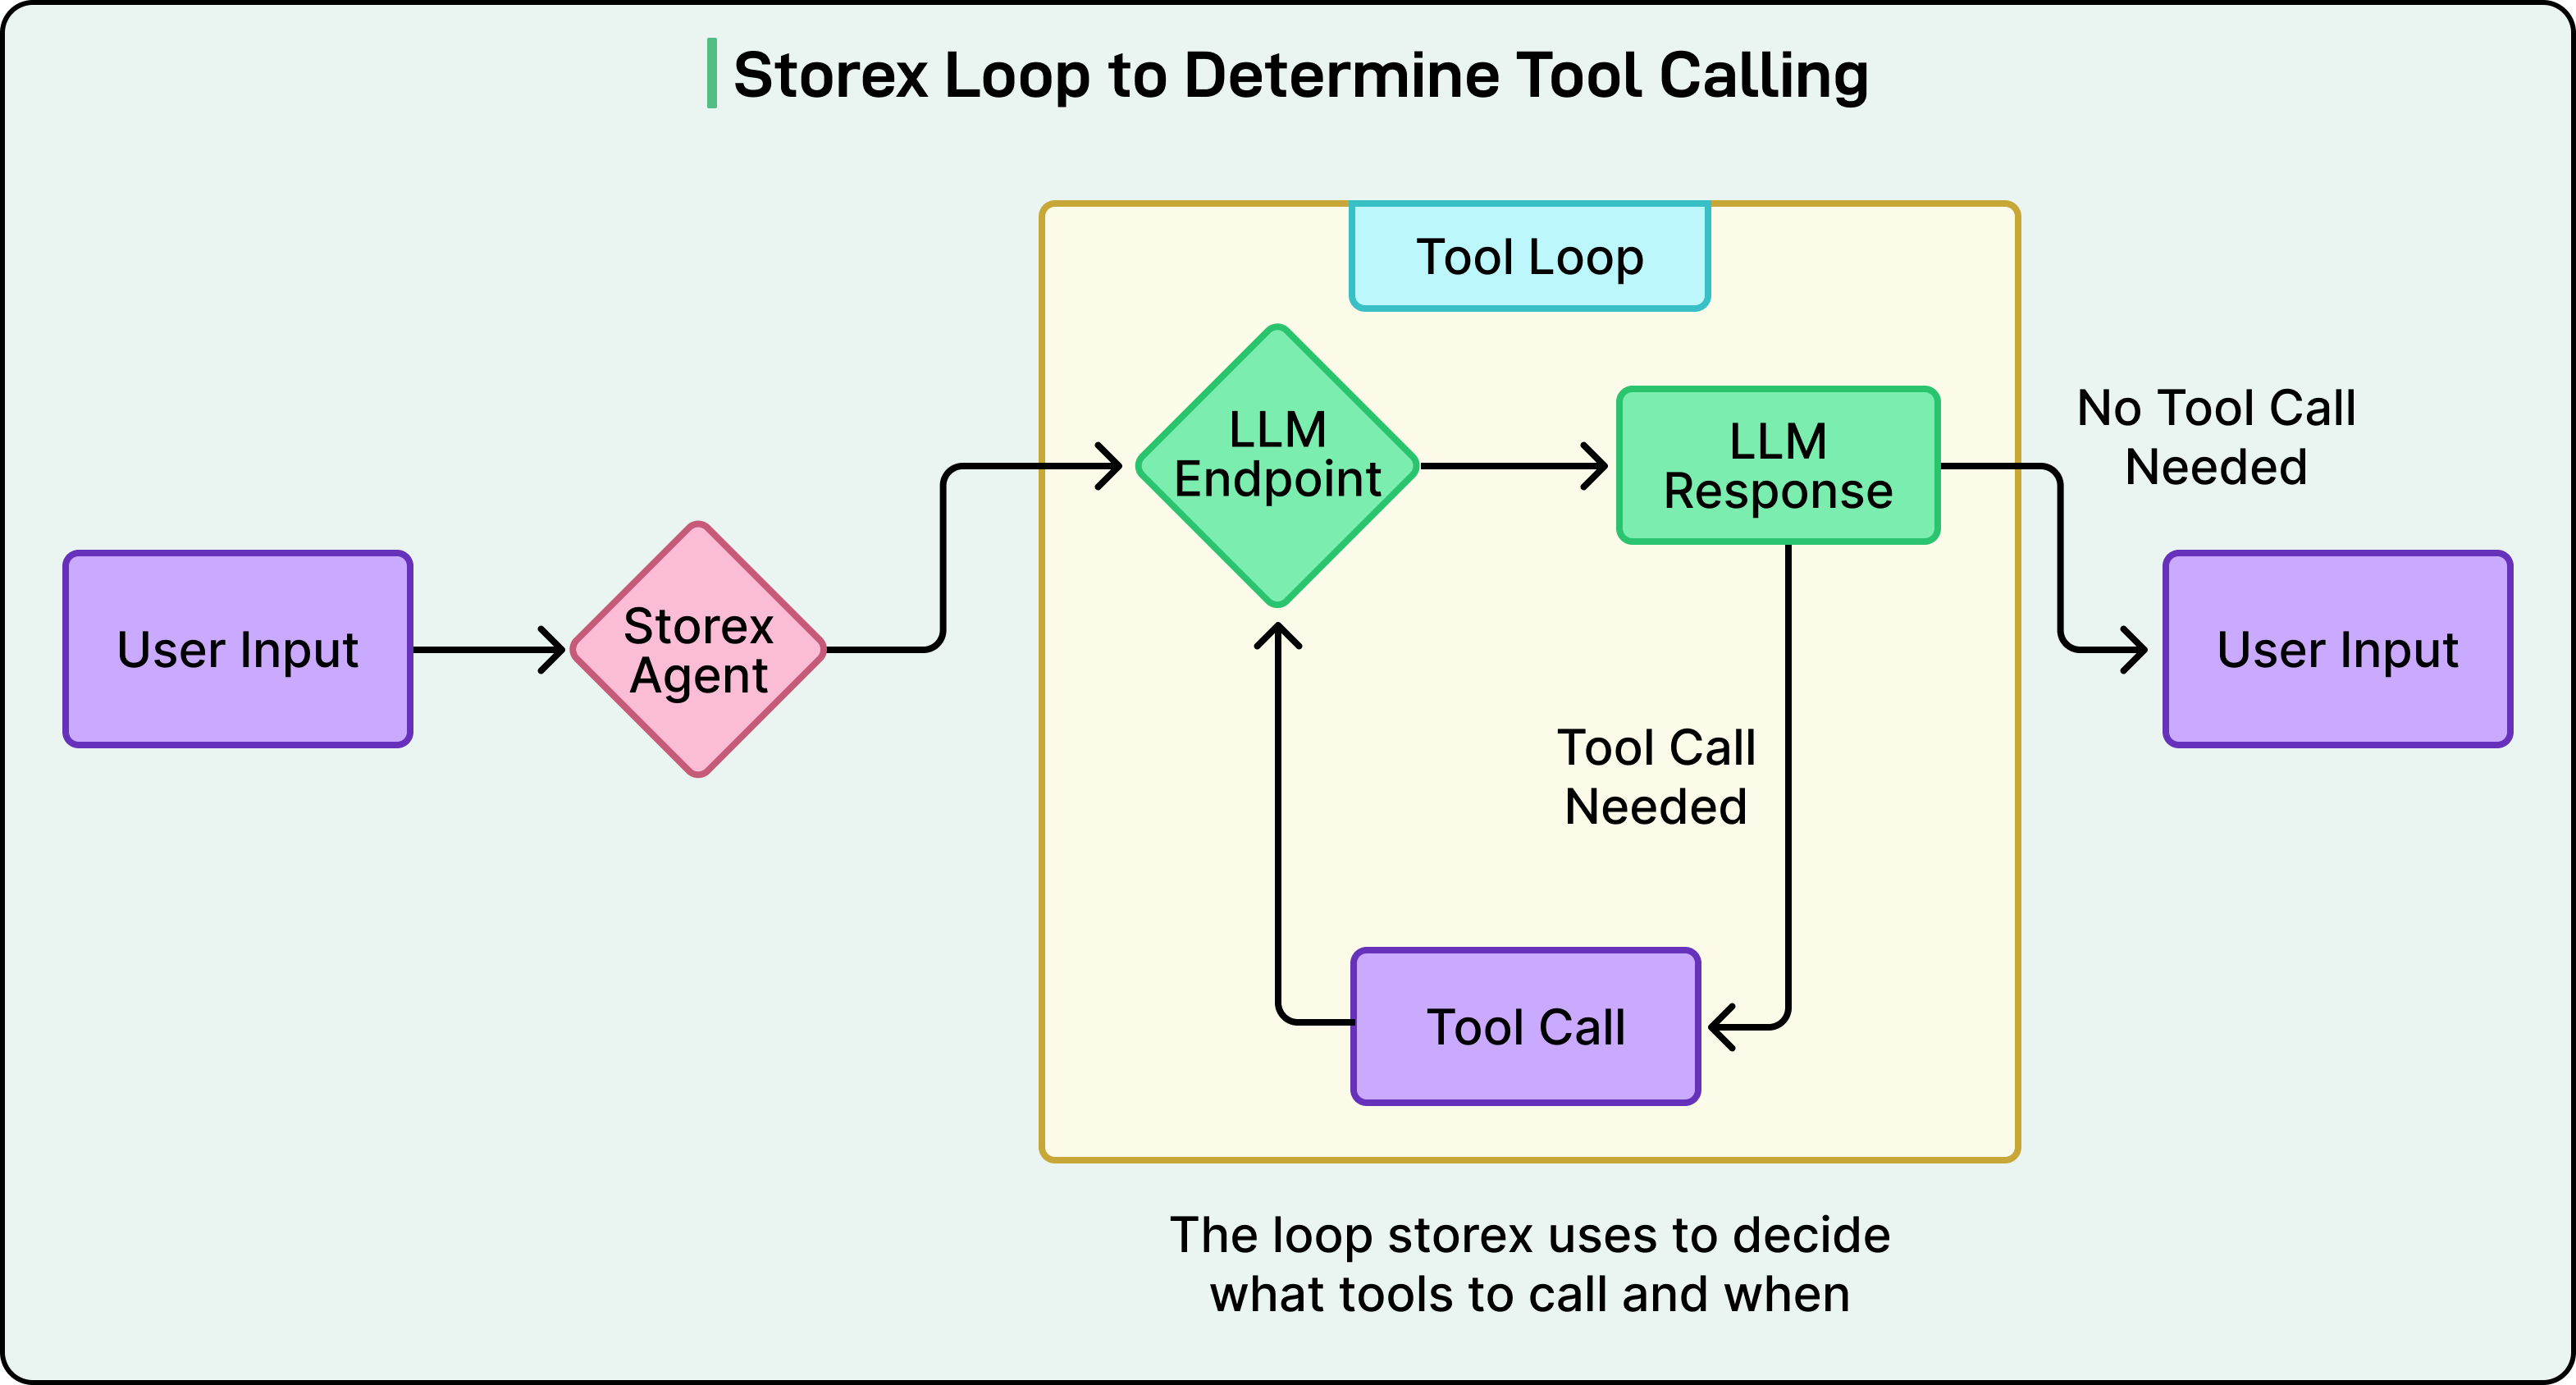
Agent Decision Loop
The AI agent operates in a continuous decision loop that determines what actions to take based on the user’s needs.
First, the user’s input goes to the Storex Router, which is like a switchboard that directs the request to the right place.
Second, the LLM Endpoint (the large language model) generates a response based on what the user asked and the current context of the conversation.
Third, if the LLM determines it needs more information, it executes a Tool Call to retrieve data like database metrics, logs, or configuration details.
Fourth, the LLM Response processes the output from the tool, interpreting what the data means in the context of the user’s question.
Fifth, the system either loops back to step 2 to gather more information with additional tool calls or it produces a final User Response if it has everything needed to answer the question.
Validation Framework
Databricks built a validation framework to ensure that as they improve the AI agent, they don’t accidentally make it worse or introduce bugs (called “regressions”).
The framework captures snapshots of production state, which are like frozen moments in time that record what the databases looked like, what problems existed, and what the correct diagnosis should be. The snapshots include database schemas (the structure of the data), physical database info (hardware and configuration details), metrics like CPU usage and IOPS (input/output operations per second), and the expected diagnostic outputs that represent the “correct answer”. These snapshots are then replayed through the agent, meaning the system feeds old problems to the new version of the AI to see how it handles them. A separate “judge” LLM scores the agent’s responses on two key criteria: accuracy (did it identify the problem correctly) and helpfulness (did it provide useful guidance to the engineer).
See the diagram below:
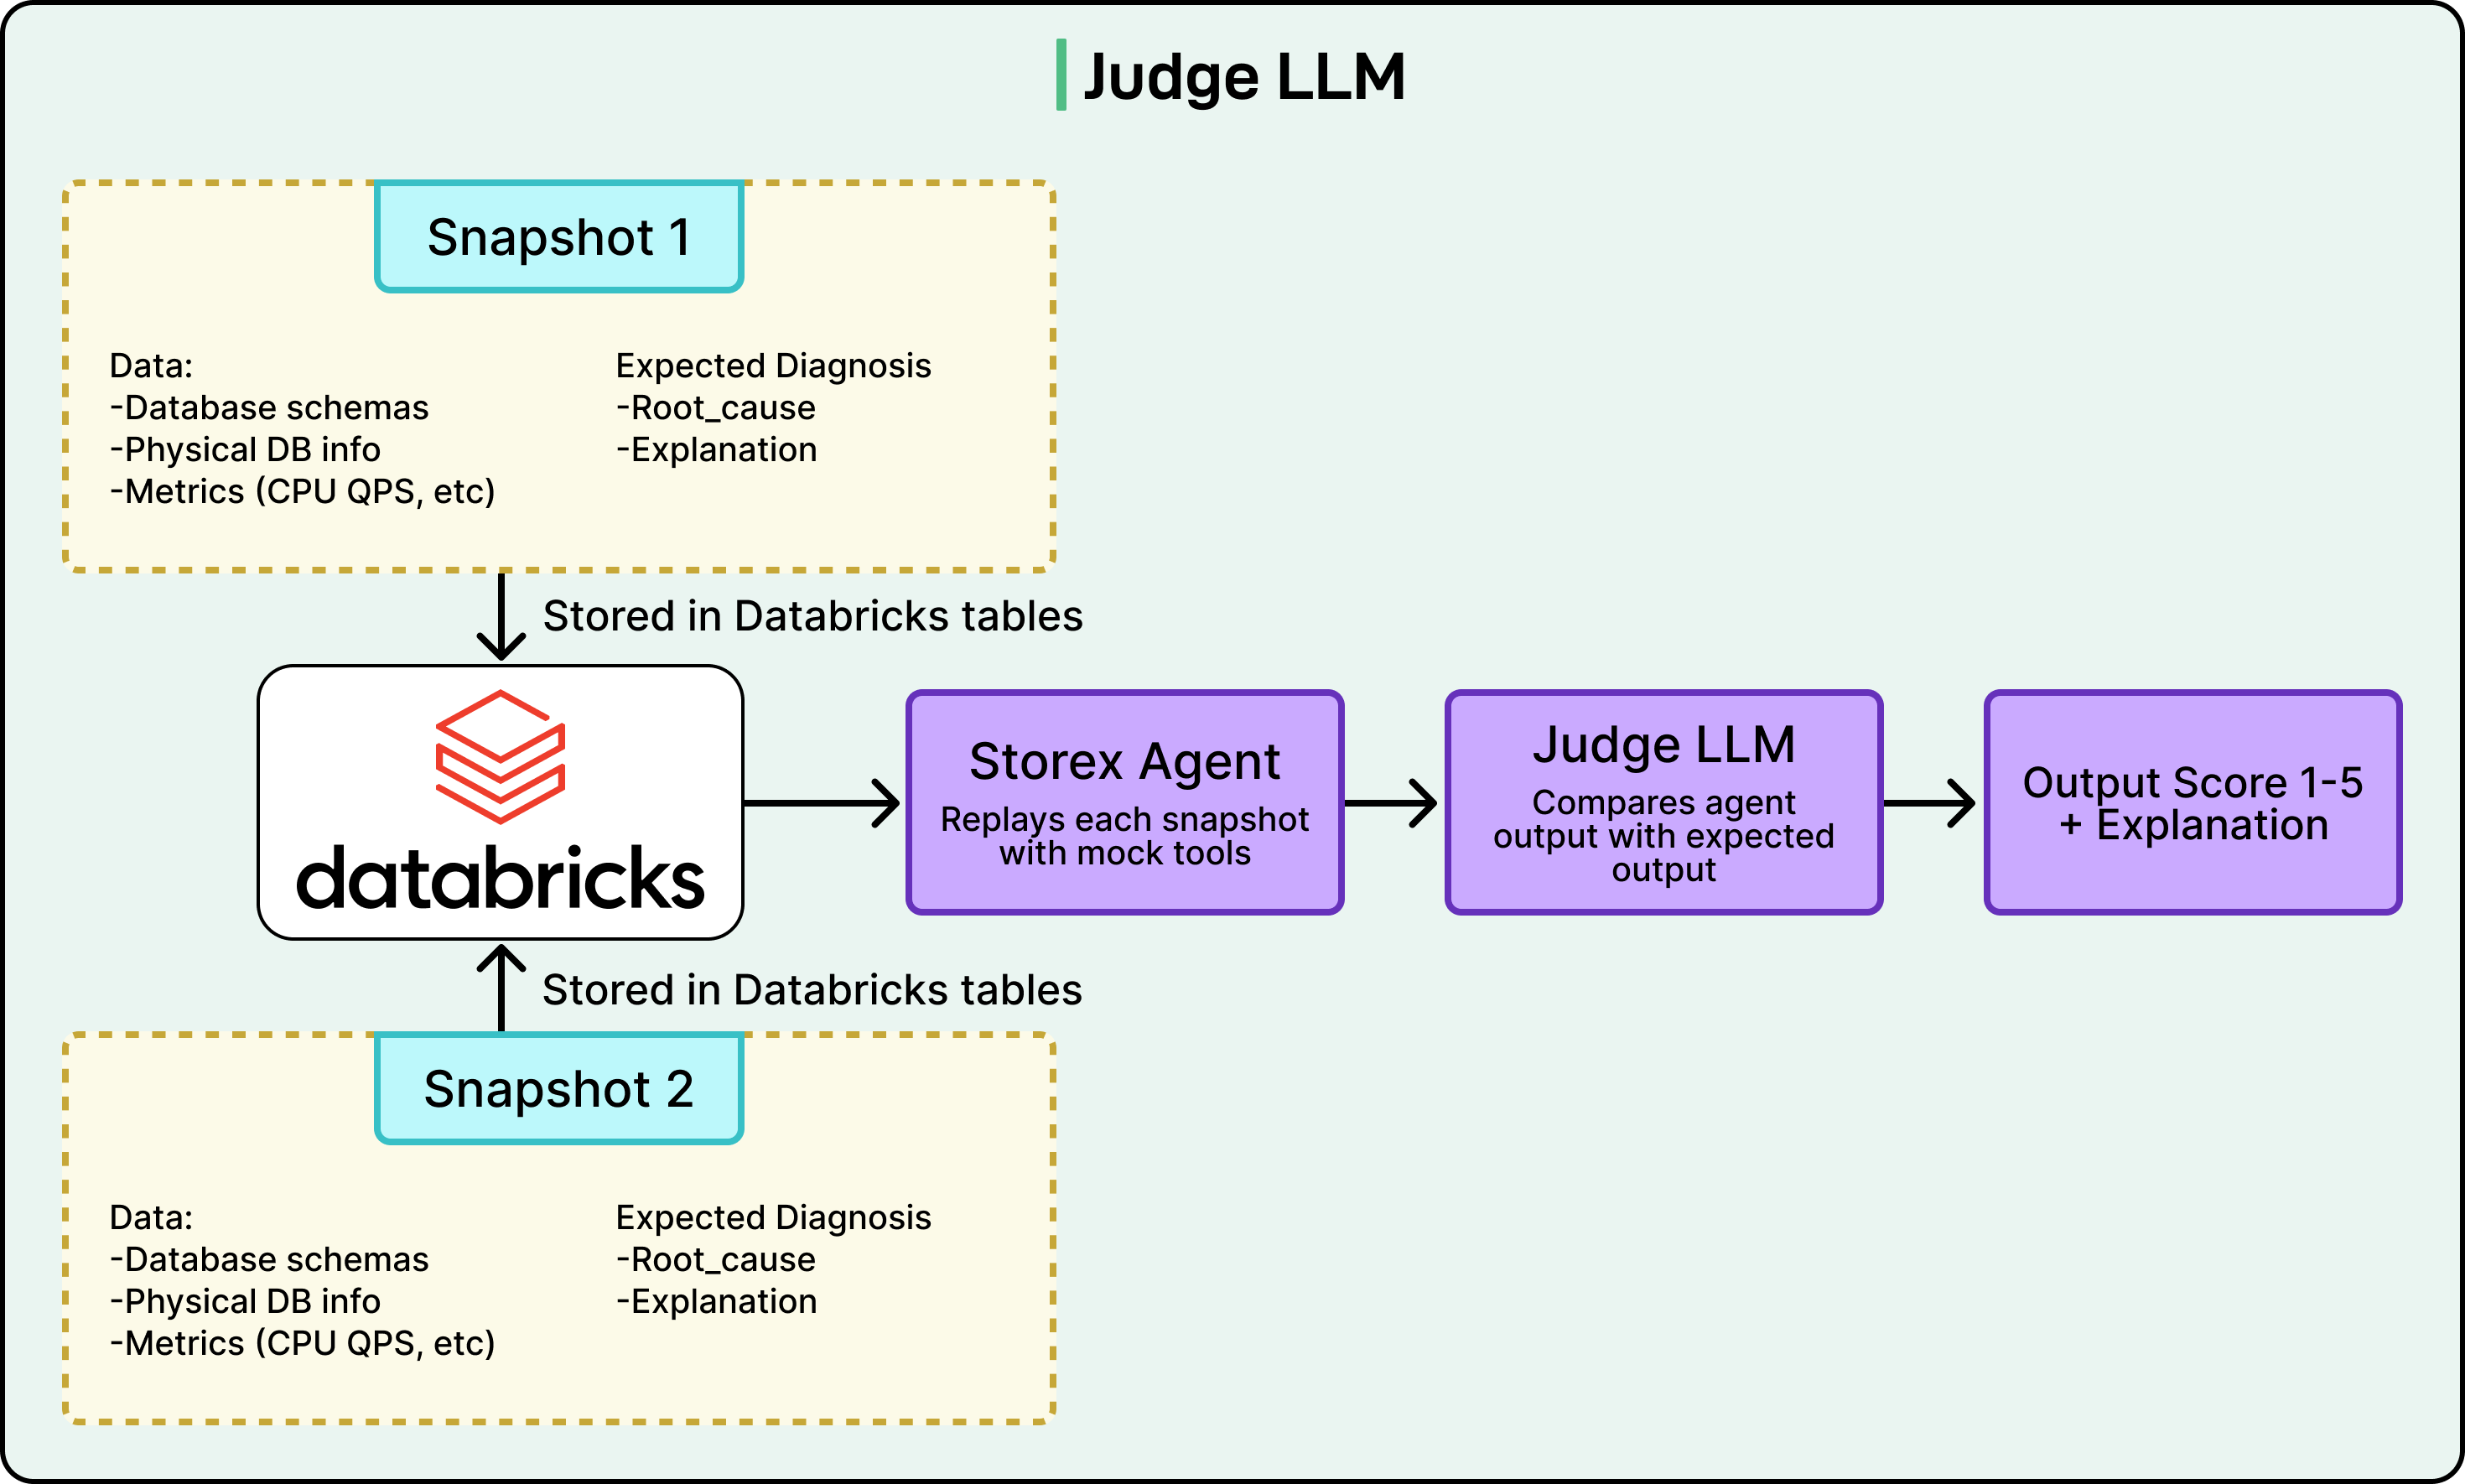
All of these test results are stored in Databricks tables so the team can analyze trends over time and understand whether their changes are actually improving the agent.
Multi-Agent Specialization
Rather than building one giant AI agent that tries to do everything, Databricks’ framework enables them to create specialized agents that each focus on different domains or areas of expertise.
They have a system and database issues agent that specializes in low-level technical problems with the database software and hardware. They have a client-side traffic patterns agent that specializes in understanding how applications are using the database and whether unusual workload patterns are causing problems.
The framework allows them to easily create additional domain-specific agents as they identify new areas where specialized knowledge would be helpful. Each agent builds deep expertise in its particular area by having prompts, tools, and context specifically tailored to that domain, rather than being a generalist.
These specialized agents can collaborate with each other to provide complete root cause analysis, where one agent might identify a traffic spike and another might correlate it with a specific database configuration issue.
Conclusion
The results of Databricks’ AI-assisted debugging platform have been transformative across multiple dimensions.
The platform achieved up to 90% reduction in debugging time, turning what were once hours-long investigations into tasks that can be completed in minutes. Perhaps most remarkably, new engineers with zero context can now jump-start a database investigation in under 5 minutes. This was something that was previously nearly impossible without significant training and experience. The platform has achieved company-wide adoption across all engineering teams, demonstrating its universal value beyond just the database specialists who originally needed it.
The user feedback has been quite positive, with engineers pointing out that they no longer need to remember where various query dashboards are located or spend time figuring out where to find specific information. Multiple engineers described the platform as a big change in developer experience.
Looking forward, the platform lays the foundation for AI-assisted production operations, including automated database restores, production query optimization, and configuration updates. The architecture is designed to extend beyond databases to other infrastructure components, promising to transform how Databricks operates its entire cloud infrastructure at scale.
References:
SPONSOR US
Get your product in front of more than 1,000,000 tech professionals.
Our newsletter puts your products and services directly in front of an audience that matters - hundreds of thousands of engineering leaders and senior engineers - who have influence over significant tech decisions and big purchases.
Space Fills Up Fast - Reserve Today
Ad spots typically sell out about 4 weeks in advance. To ensure your ad reaches this influential audience, reserve your space now by emailing sponsorship@bytebytego.com.
The irony is that Databases are also transforming AI by fixing its Amnesia problem. This video breaks it down: https://youtu.be/Js6GTQrkbqg