
How Databricks Implemented Intelligent Kubernetes Load Balancing

Is your team building or scaling AI agents?(Sponsored)

One of AI’s biggest challenges today is memory—how agents retain, recall, and remember over time. Without it, even the best models struggle with context loss, inconsistency, and limited scalability.
This new O’Reilly + Redis report breaks down why memory is the foundation of scalable AI systems and how real-time architectures make it possible.
Inside the report:
The role of short-term, long-term, and persistent memory in agent performance
Frameworks like LangGraph, Mem0, and Redis
Architectural patterns for faster, more reliable, context-aware systems
Disclaimer: The details in this post have been derived from the details shared online by the Databricks Engineering Team. All credit for the technical details goes to the Databricks Engineering Team. The links to the original articles and sources are present in the references section at the end of the post. We’ve attempted to analyze the details and provide our input about them. If you find any inaccuracies or omissions, please leave a comment, and we will do our best to fix them.
Kubernetes has become the standard platform for running modern microservices. It simplifies how services talk to each other through built-in networking components like ClusterIP services, CoreDNS, and kube-proxy. These primitives work well for many workloads, but they start to show their limitations when traffic becomes high volume, persistent, and latency sensitive.
Databricks faced exactly this challenge. Many of their internal services rely on gRPC, which runs over HTTP/2 and keeps long-lived TCP connections between clients and servers. Under Kubernetes’ default model, this leads to uneven traffic distribution, unpredictable scaling behavior, and higher tail latencies.
By default, Kubernetes uses ClusterIP services, CoreDNS, and kube-proxy (iptables/IPVS/eBPF) to route traffic:
Clients resolve the service DNS (for example, my-service.default.svc.cluster.local) to a ClusterIP.
The packet goes to the ClusterIP.
kube-proxy selects a backend pod using round robin or random selection.
Since the selection happens only once per TCP connection, the same backend pod keeps receiving traffic for the lifetime of that connection. For short-lived HTTP/1 connections, this is usually fine. However, for persistent HTTP/2 connections, the result is traffic skew: a few pods get overloaded while others stay idle.
For Databricks, this created several operational issues:
High tail latency: A few pods handled most of the load, which increased response time for users.
Poor resource utilization: Some pods were overwhelmed while others sat idle, leading to over-provisioning.
Limited strategies: The Kubernetes built-in load balancing had no way to handle error-aware or zone-aware routing.
The Databricks Engineering Team needed something smarter: a Layer 7, request-level load balancer that could react dynamically to real service conditions instead of relying on connection-level routing decisions.
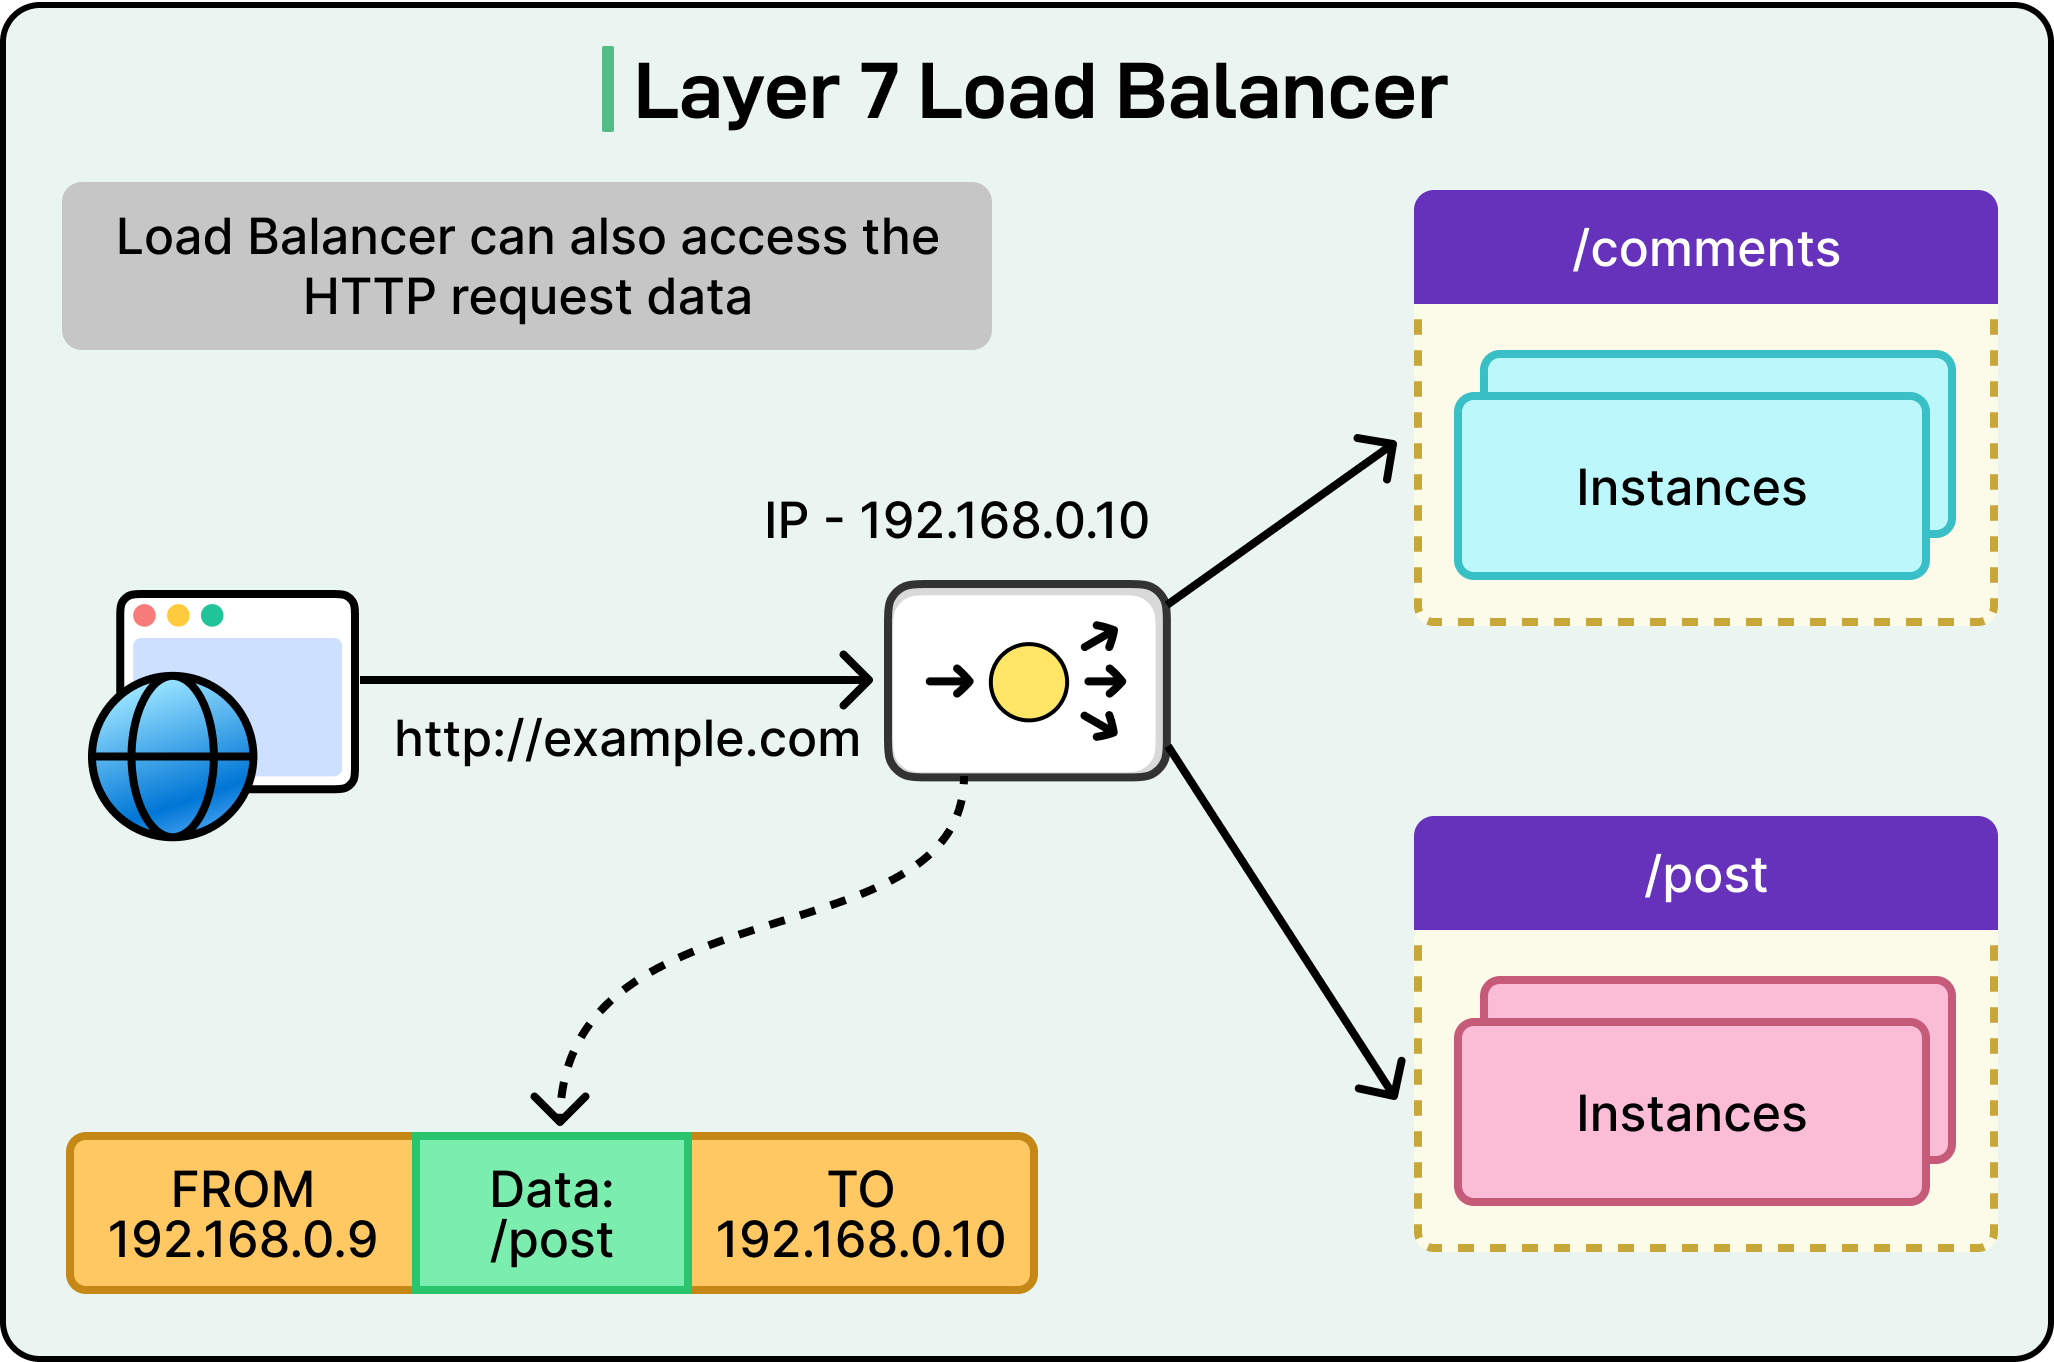
In this article, we will learn how they built such a system and the challenges they faced along the way.
The Core Solution
To overcome the limitations of the default Kubernetes routing, the Databricks Engineering Team shifted the load balancing responsibility from the infrastructure layer to the client itself. Instead of depending on kube-proxy and DNS to make connection-level routing decisions, they built a client-side load balancing system supported by a lightweight control plane that provides real-time service discovery.
This means the application client no longer waits for DNS to resolve a service or for kube-proxy to pick a backend pod. Instead, it already knows which pods are healthy and available. When a request is made, the client can choose the best backend at that moment based on up-to-date information.
Here’s a table that shows the difference between the default Kubernetes LB and Databricks client-side LB:
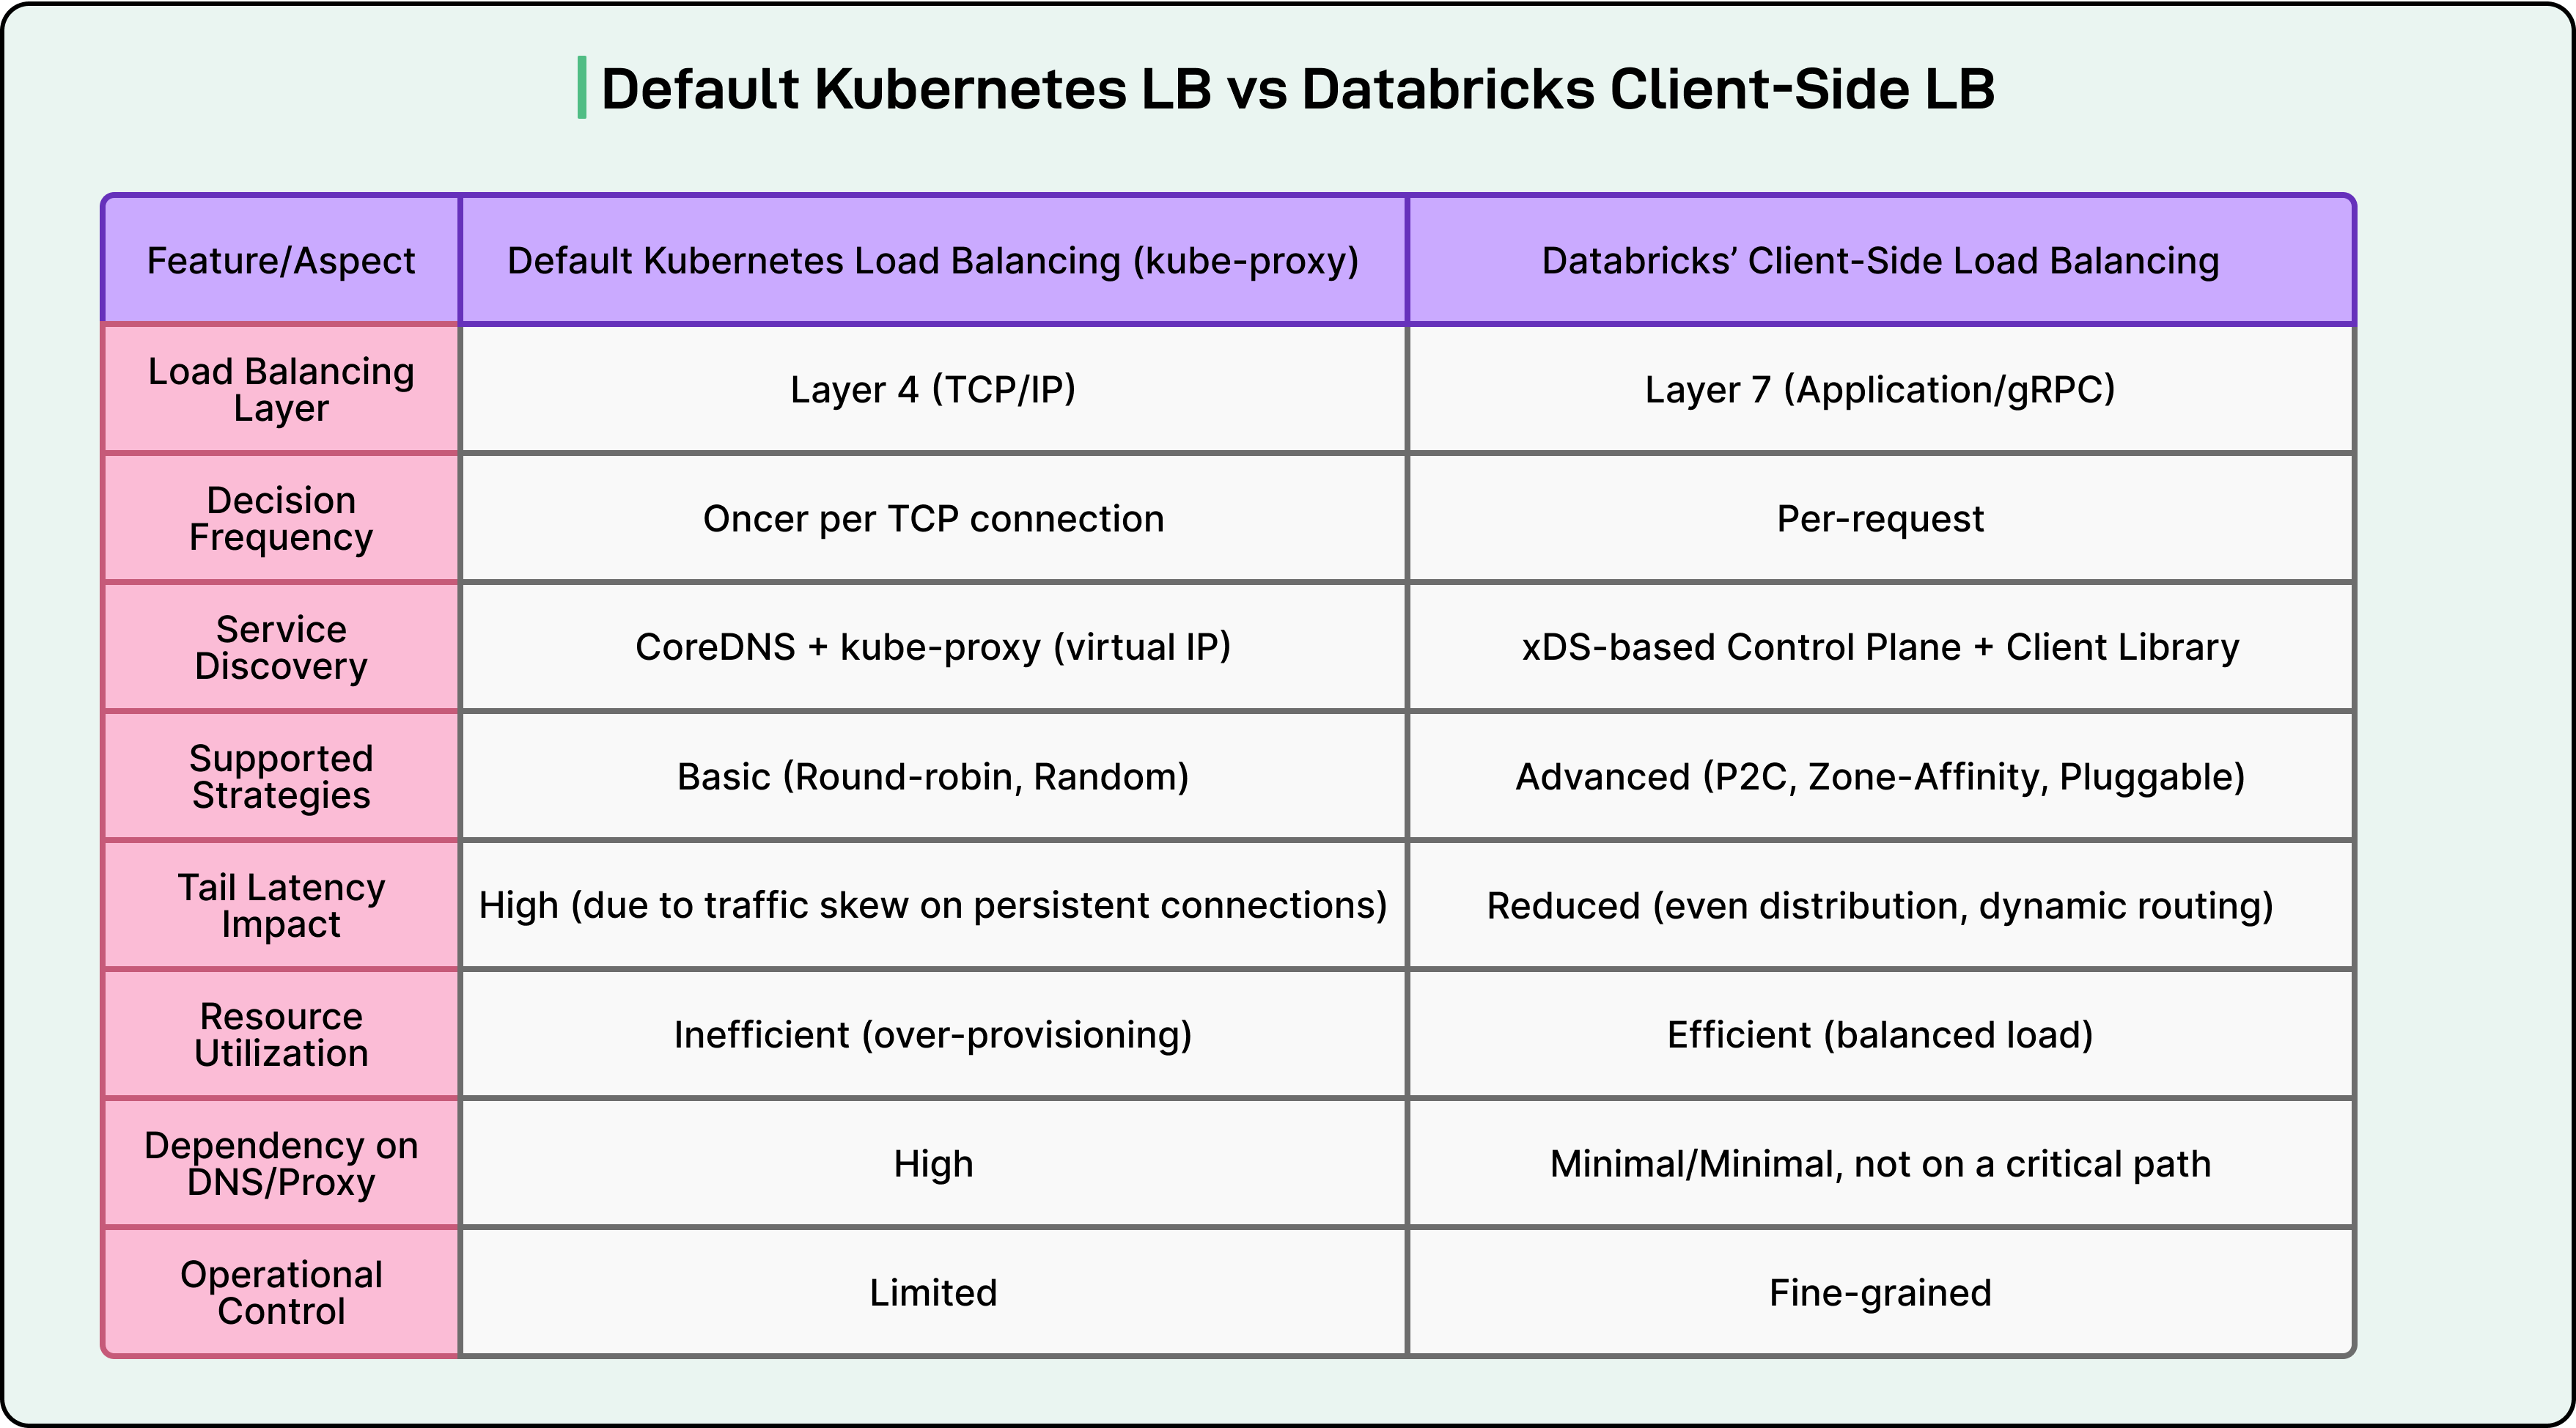
By removing DNS from the critical path, the system gives each client a direct and current view of available endpoints. This allows smarter, per-request routing decisions instead of static, per-connection routing. The result is more even traffic distribution, lower latency, and better use of resources across pods.
This approach also gives Databricks greater flexibility to fine-tune how traffic flows between services, something that is difficult to achieve with the default Kubernetes model.
Custom Control Plane - Endpoint Discovery Service
A key part of the intelligent load balancing system is its custom control plane. This component is responsible for keeping an accurate, real-time view of the services running inside the Kubernetes cluster. Instead of depending on DNS lookups or static routing, the control plane continuously monitors the cluster and provides live endpoint information to clients.
See the diagram below:
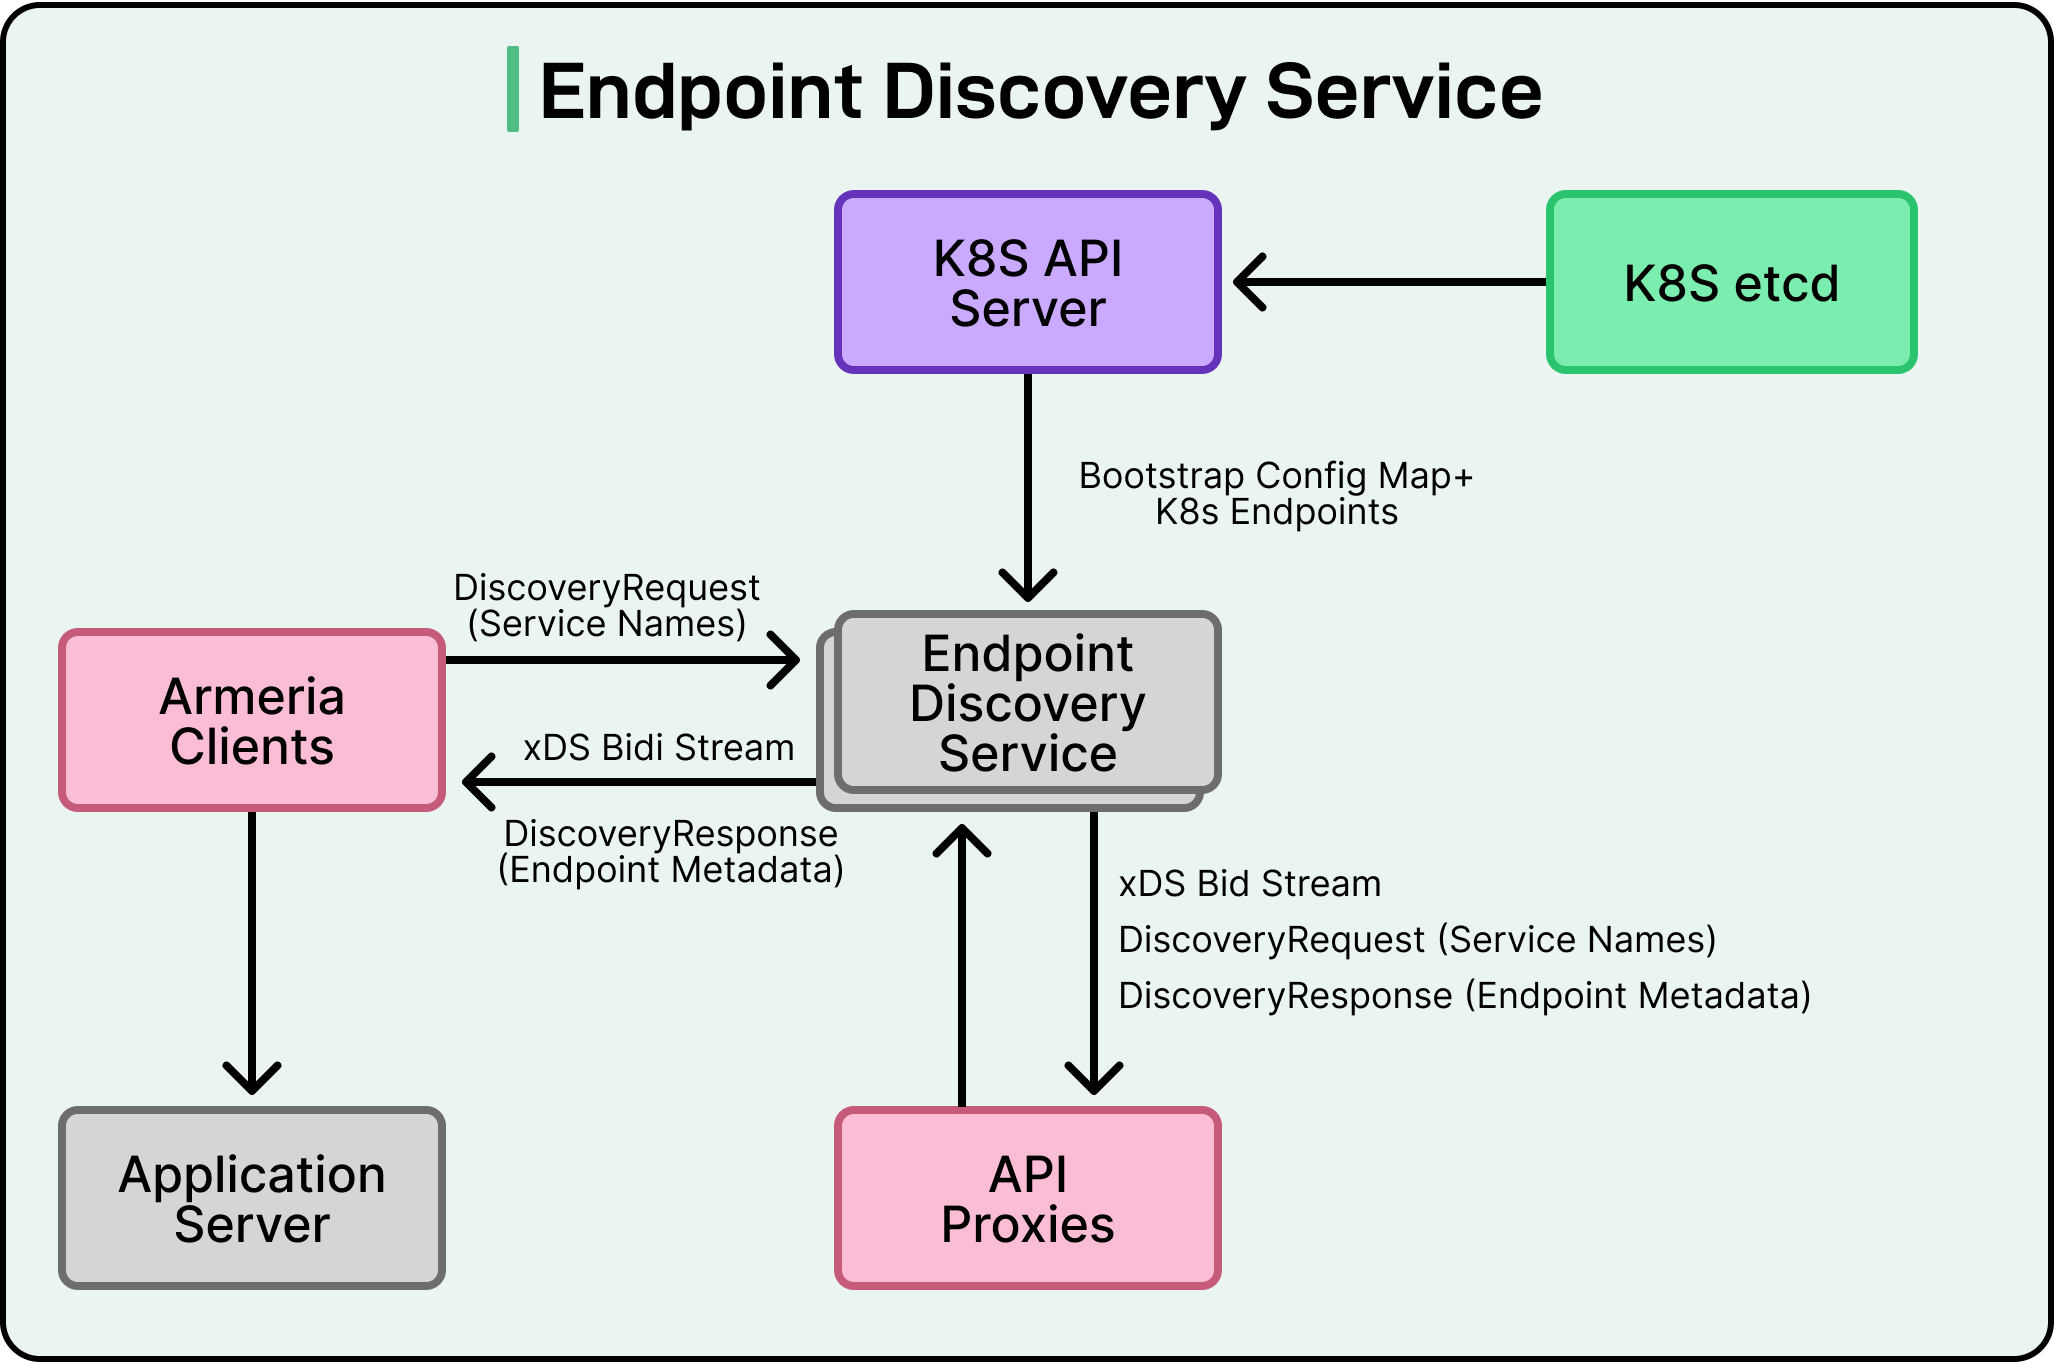
Here is how it works:
Watching the Kubernetes API: The control plane keeps a close watch on Kubernetes resources like Services and EndpointSlices. EndpointSlices contain details about all the pods that belong to a service, including their IP addresses and health status. Whenever pods are added, removed, or their state changes, the control plane detects it almost immediately.
Building a real-time topology: It maintains an internal map of all backend pods for each service. This includes important metadata such as:
Zone information to know where the pod is running (useful for zone-affinity routing).
Readiness status to make sure only healthy pods receive traffic.
Shard labels or other identifying information to route traffic intelligently.
Translating data into xDS responses: The control plane converts this information into xDS (Envoy Discovery Service) responses. xDS is a widely used API protocol that allows clients and proxies to receive dynamic configuration updates, including endpoint lists.
Streaming updates to clients and proxies: Instead of polling or re-resolving DNS, clients subscribe to the control plane and receive continuous streaming updates whenever endpoints change. If a pod goes down, the client learns about it almost immediately and routes requests elsewhere. If a new pod comes online, it can start receiving traffic right away.
This design has several benefits:
Clients don’t have to wait for DNS to expire or connections to break.
Routing decisions are based on the most recent view of the cluster.
This removes one of the common bottlenecks in large-scale Kubernetes systems.
Client Integration with RPC Frameworks
For any load-balancing system to work at scale, it has to be easy for application teams to adopt. Databricks solved this by directly integrating the new load-balancing logic into their shared RPC client framework, which is used by most of their internal services.
Since many Databricks services are written in Scala, the engineering team was able to build this capability once and make it available to all services without extra effort from individual teams.
Here is how the integration works:
Subscribing to EDS updates: Each service uses a custom RPC client that automatically subscribes to the Endpoint Discovery Service (EDS) for any other service it depends on. This means the client is always aware of which pods are available and healthy.
Maintaining an in-memory list of endpoints: The client keeps a live, in-memory list of healthy endpoints, along with useful metadata like zone information, shard labels, and readiness status. This list updates automatically whenever the control plane sends new information.
Bypassing DNS and kube-proxy: Because the client already knows which endpoints are available, it doesn’t need to perform DNS lookups or rely on kube-proxy to pick a backend pod. It can select the right pod for each request directly.
Seamless organization-wide adoption: By embedding the logic inside the shared client library, Databricks made it possible for all teams to benefit from intelligent load balancing without changing their application code or deploying complex sidecars. This reduced operational overhead and made rollout much simpler.
Advanced Load Balancing Strategies
One of the biggest advantages of the client-side load balancing system at Databricks is its flexibility. Since the routing happens inside the client and is based on real-time data, the system can use more advanced strategies than the basic round-robin or random selection used by kube-proxy.
These strategies allow the client to make smarter routing decisions for every request, improving performance, reliability, and resource efficiency.
Power of Two Choices (P2C)
The Power of Two Choices algorithm is simple but powerful. When a request comes in, the client:
Randomly selects two healthy endpoints.
Checks their current load.
Sends the request to the less loaded of the two.
This approach avoids both random traffic spikes and overloaded pods. It balances traffic more evenly than round-robin while keeping the logic lightweight and fast. Databricks found that P2C works well for the majority of its services.
Zone-Affinity Routing
In large, distributed Kubernetes clusters, network latency can increase when traffic crosses zones.
To minimize this, the team uses zone-affinity routing:
The client prefers endpoints in the same zone as the caller to reduce latency and data transfer costs.
If that zone is overloaded or unhealthy, the client intelligently spills traffic to other zones with available capacity.
This helps maintain low latency while ensuring the system remains resilient to partial failures.
Pluggable Strategies
The architecture is designed to be extensible. The team can easily add new load-balancing strategies without changing the overall system. For example:
Weighted routing, where traffic is distributed based on custom weights (such as pod capacity or specialized hardware).
Application-specific routing, where strategies can be tuned for specific workloads like AI or analytics.
xDS Integration with Envoy for Ingress Traffic
The Databricks Engineering Team didn’t limit its intelligent load balancing system to internal traffic. They also extended their Endpoint Discovery Service (EDS) control plane to work with Envoy, which manages external ingress traffic. This means that both internal service-to-service communication and traffic coming into the cluster from outside follow the same set of routing rules.
Here’s how this works:
Providing real-time endpoint data to Envoy: The control plane implements the Endpoint Discovery Service (EDS) protocol. This allows it to send Envoy up-to-date information about all backend clusters and their endpoints. As pods are added, removed, or change their status, Envoy receives immediate updates, ensuring that external traffic is always directed to healthy and available pods.
Consistent routing for internal and external traffic: Because both the internal clients and Envoy use the same control plane as their source of truth, routing decisions remain consistent across the entire platform. There’s no risk of external traffic being sent to stale endpoints or diverging from internal routing logic.
Unified service discovery: This design avoids maintaining multiple service discovery systems for different types of traffic. Instead, Databricks uses a single, centralized control plane to manage endpoint information for both internal RPC calls and ingress gateway routing.
Conclusion
The shift to client-side load balancing brought measurable benefits to Databricks’ infrastructure. After deploying the new system, the traffic distribution across pods became uniform, eliminating the issue of a few pods being overloaded while others sat idle.
This led to stable latency profiles, with P90 and tail latencies becoming much more predictable, and a 20 percent reduction in pod count across multiple services.

The improved balance meant Databricks could achieve better performance without over-provisioning resources.
The rollout also surfaced some important lessons:
Cold starts became more noticeable because new pods began receiving traffic immediately after coming online. To address this, the team introduced slow-start ramp-up and a mechanism to bias traffic away from pods with high error rates.
Another lesson came from experimenting with metrics-based routing. Relying on CPU and memory metrics turned out to be unreliable, as these signals often lag behind real-time conditions. The team shifted to using health-based signals, which provided more accurate and timely routing decisions.
Additionally, not all services could benefit from this system immediately, since not every language had a compatible client library, meaning some traffic still relied on traditional load balancing.
Looking ahead, Databricks is working on cross-cluster and cross-region load balancing to scale this system globally using flat L3 networking and multi-region EDS clusters. The team is also exploring advanced AI-aware strategies, including weighted load balancing for specialized backends. These future improvements are aimed at handling even larger workloads, supporting AI-heavy applications, and maintaining high reliability as their platform grows.
Through this architecture, Databricks has demonstrated a practical way to overcome the limitations of the default Kubernetes load balancing and build a flexible, efficient, and scalable traffic management system.
References:
SPONSOR US
Get your product in front of more than 1,000,000 tech professionals.
Our newsletter puts your products and services directly in front of an audience that matters - hundreds of thousands of engineering leaders and senior engineers - who have influence over significant tech decisions and big purchases.
Space Fills Up Fast - Reserve Today
Ad spots typically sell out about 4 weeks in advance. To ensure your ad reaches this influential audience, reserve your space now by emailing sponsorship@bytebytego.com.
why not use headless service and do client side loadbalancing at the microservice level?