
How DoorDash Moved to a Service Mesh to Handle 80M Requests/Second

AI Meets Streaming: Build Real-Time Architectures with AWS + Redpanda (Sponsored)

Join us live on December 11 for a Redpanda Tech Talk with AWS experts on how to bring Agentic and Generative AI into real-time data pipelines. Redpanda Solutions Engineer Garrett Raska and AWS Partner Solutions Architect Dr. Art Sedighi will walk through emerging AI patterns from AWS re:Invent and show how to integrate AI inference directly into streaming architectures. Learn how to build low-latency, context-aware applications, combine real-time signals with GenAI models, and architect reliable, production-ready AI workflows. If you’re exploring how AI transforms streaming systems, this session delivers the patterns you need to get started.
Disclaimer: The details in this post have been derived from the details shared online by the DoorDash Engineering Team. All credit for the technical details goes to the DoorDash Engineering Team. The links to the original articles and sources are present in the references section at the end of the post. We’ve attempted to analyze the details and provide our input about them. If you find any inaccuracies or omissions, please leave a comment, and we will do our best to fix them.
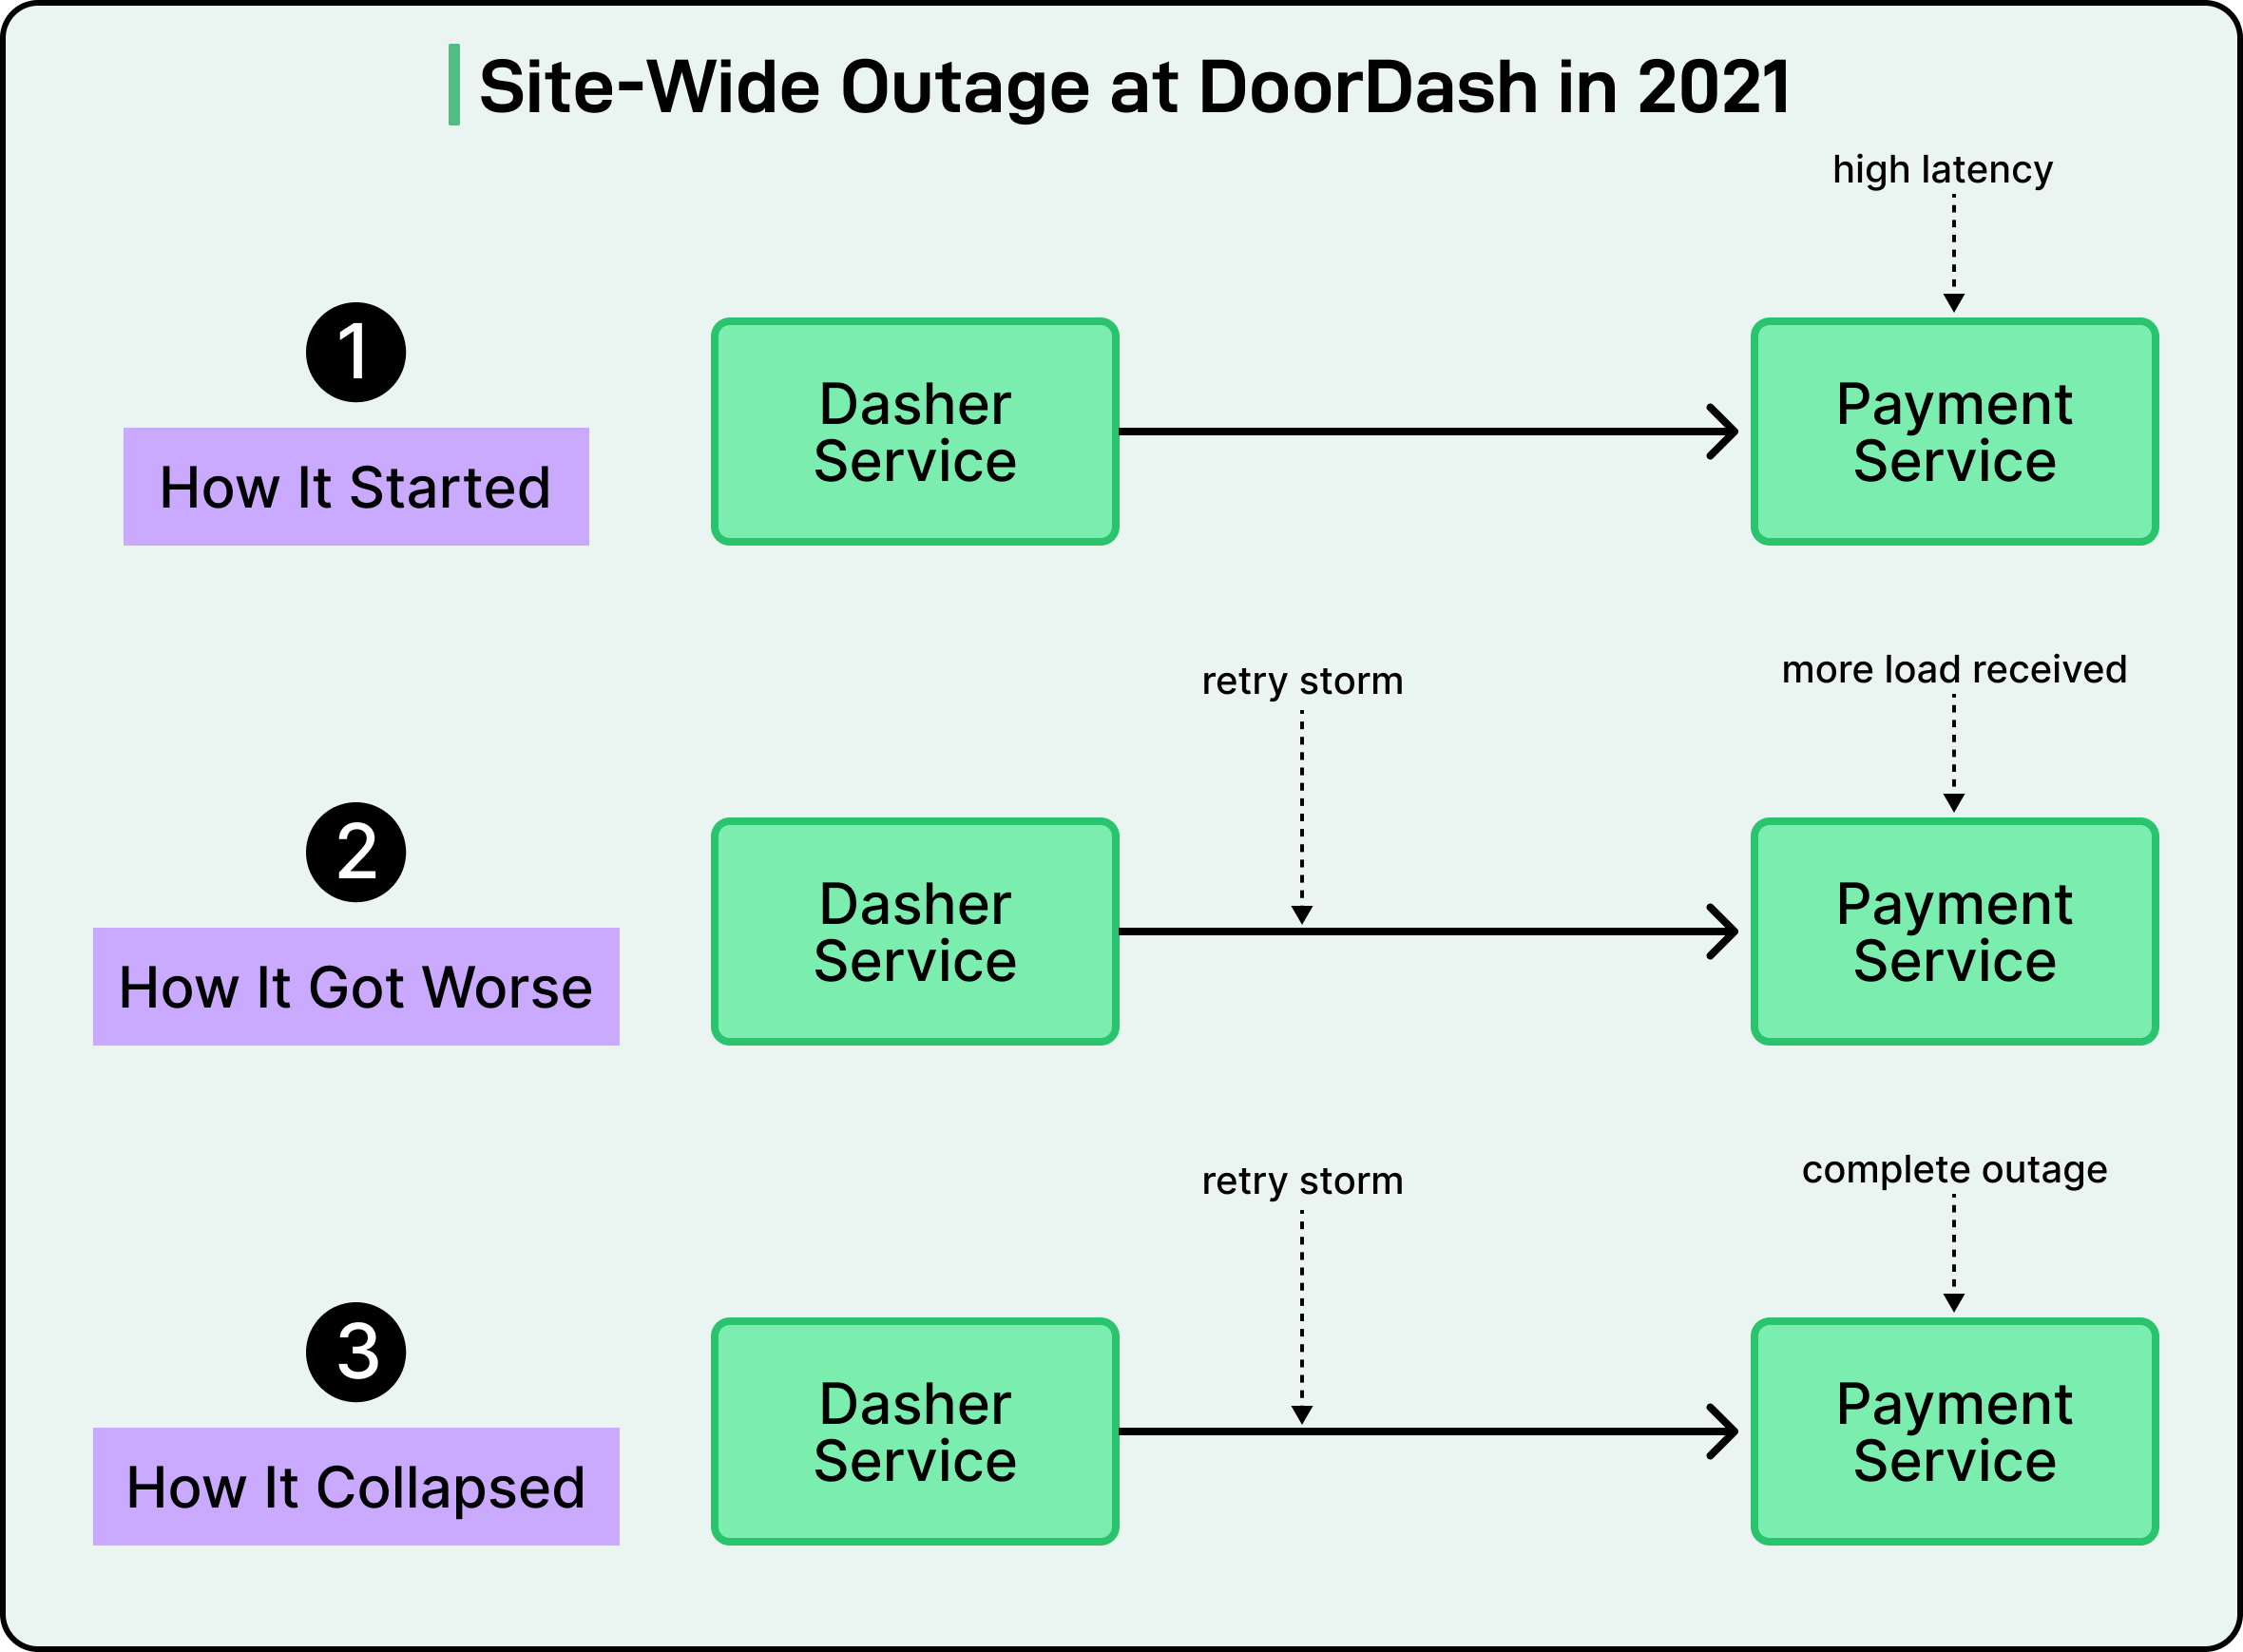
In mid-2021, DoorDash experienced a production outage that brought down the entire platform for more than two hours.
The incident started with the payment service experiencing high latency. Clients of this service interpreted the slow responses as potential failures and retried their requests. This created a retry storm where each retry added more load to an already overwhelmed service. The cascading failure spread through DoorDash’s microservices architecture as services depending on payments started timing out and failing.
See the diagram below:
This wasn’t an isolated incident. DoorDash had experienced a series of similar issues earlier as well. The problems may have been prompted by their transition from a monolith to a microservices architecture between 2019 and 2023.
Of course, it wasn’t that DoorDash was blind to reliability concerns. The team had already implemented several reliability features in their primary Kotlin-based services. However, not all services used Kotlin, which meant they either had to build their own mechanisms or go without. The payment service was also one of them.
The outage made one thing clear: their patchwork approach to reliability wasn’t working. The incident demonstrated that reliability features like Layer 7 metrics-aware circuit breakers and load shedding couldn’t remain the responsibility of individual application teams.
Based on this realization, the DoorDash engineering team decided to transition to a service mesh architecture to handle their traffic needs. By the time they began this adoption, DoorDash was operating at significant scale with over 1,000 microservices running across Kubernetes clusters containing around 2,000 nodes. Today, the system handles more than 80 million requests per second during peak hours.
In this article, we will look at how DoorDash’s infrastructure team went through this journey and the difficulties they faced.
Challenges of Microservices Architecture
Ever since DoorDash migrated away from the monolithic architecture, they started to encounter several classic challenges applicable to microservices and distributed systems.
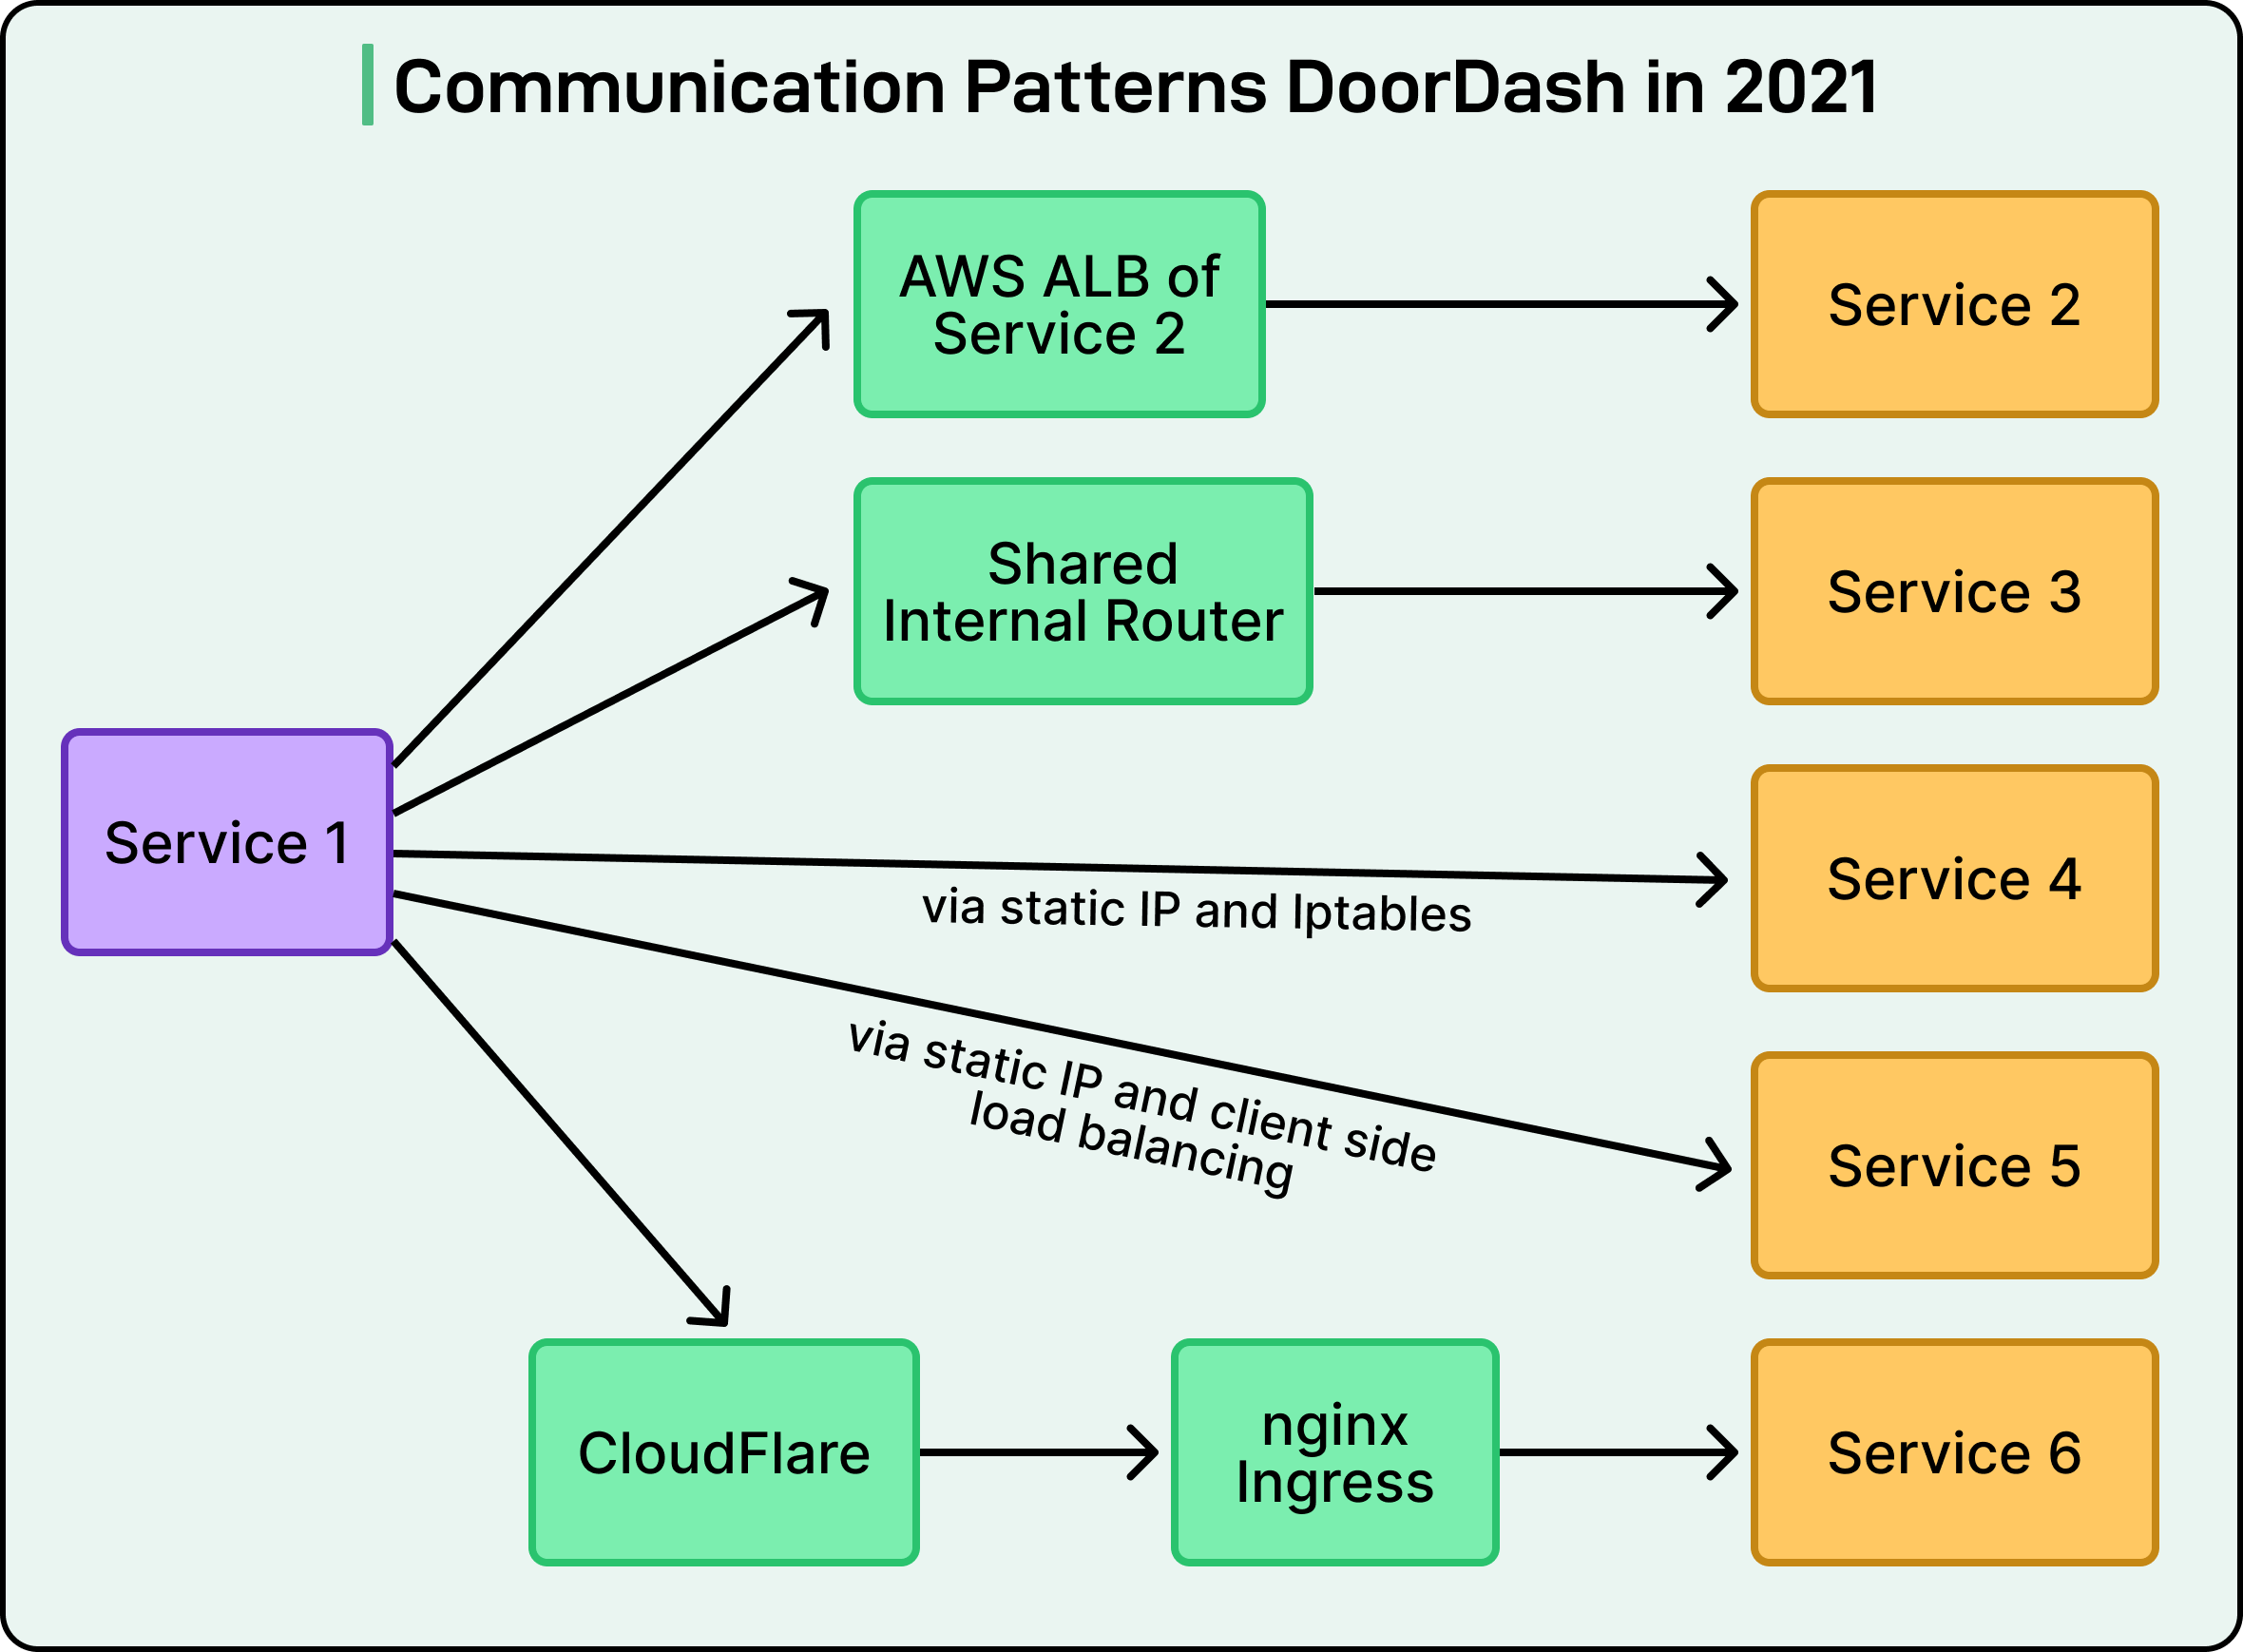
Services were communicating using different patterns with no standardization across the organization:
HTTP/1 services relied on Kubernetes DNS with static virtual IPs, where iptables handled connection-level load balancing.
Newer services used Consul-based multi-cluster DNS that returned all pod IPs directly, requiring client-side load balancing that was inconsistently implemented across different programming languages and teams.
Some gRPC services were exposed through dedicated AWS Elastic Load Balancers with external traffic policy settings to route traffic correctly
Certain services routed requests through a central internal router, creating a potential bottleneck and a single point of failure
Some services made full round-trips through public DoorDash domains before hairpinning back into internal systems. This hurt both performance and reliability
See the diagram below:
Beyond these varied communication patterns, critical platform-level features were implemented inconsistently:
Authentication and authorization mechanisms differed across services and teams, with no unified approach to securing service-to-service communication.
Retry and timeout policies varied by team and programming language, with some services lacking them entirely.
Load shedding and circuit breaker implementations were scattered and inconsistent, leaving many services vulnerable to exactly the kind of cascading failures they had just experienced.
The resulting service topology had become increasingly complex, making system-wide visibility and debugging extremely difficult.
The Goals
When it came to implementing the Service Mesh for their architecture, the DoorDash engineering team started with modest goals.
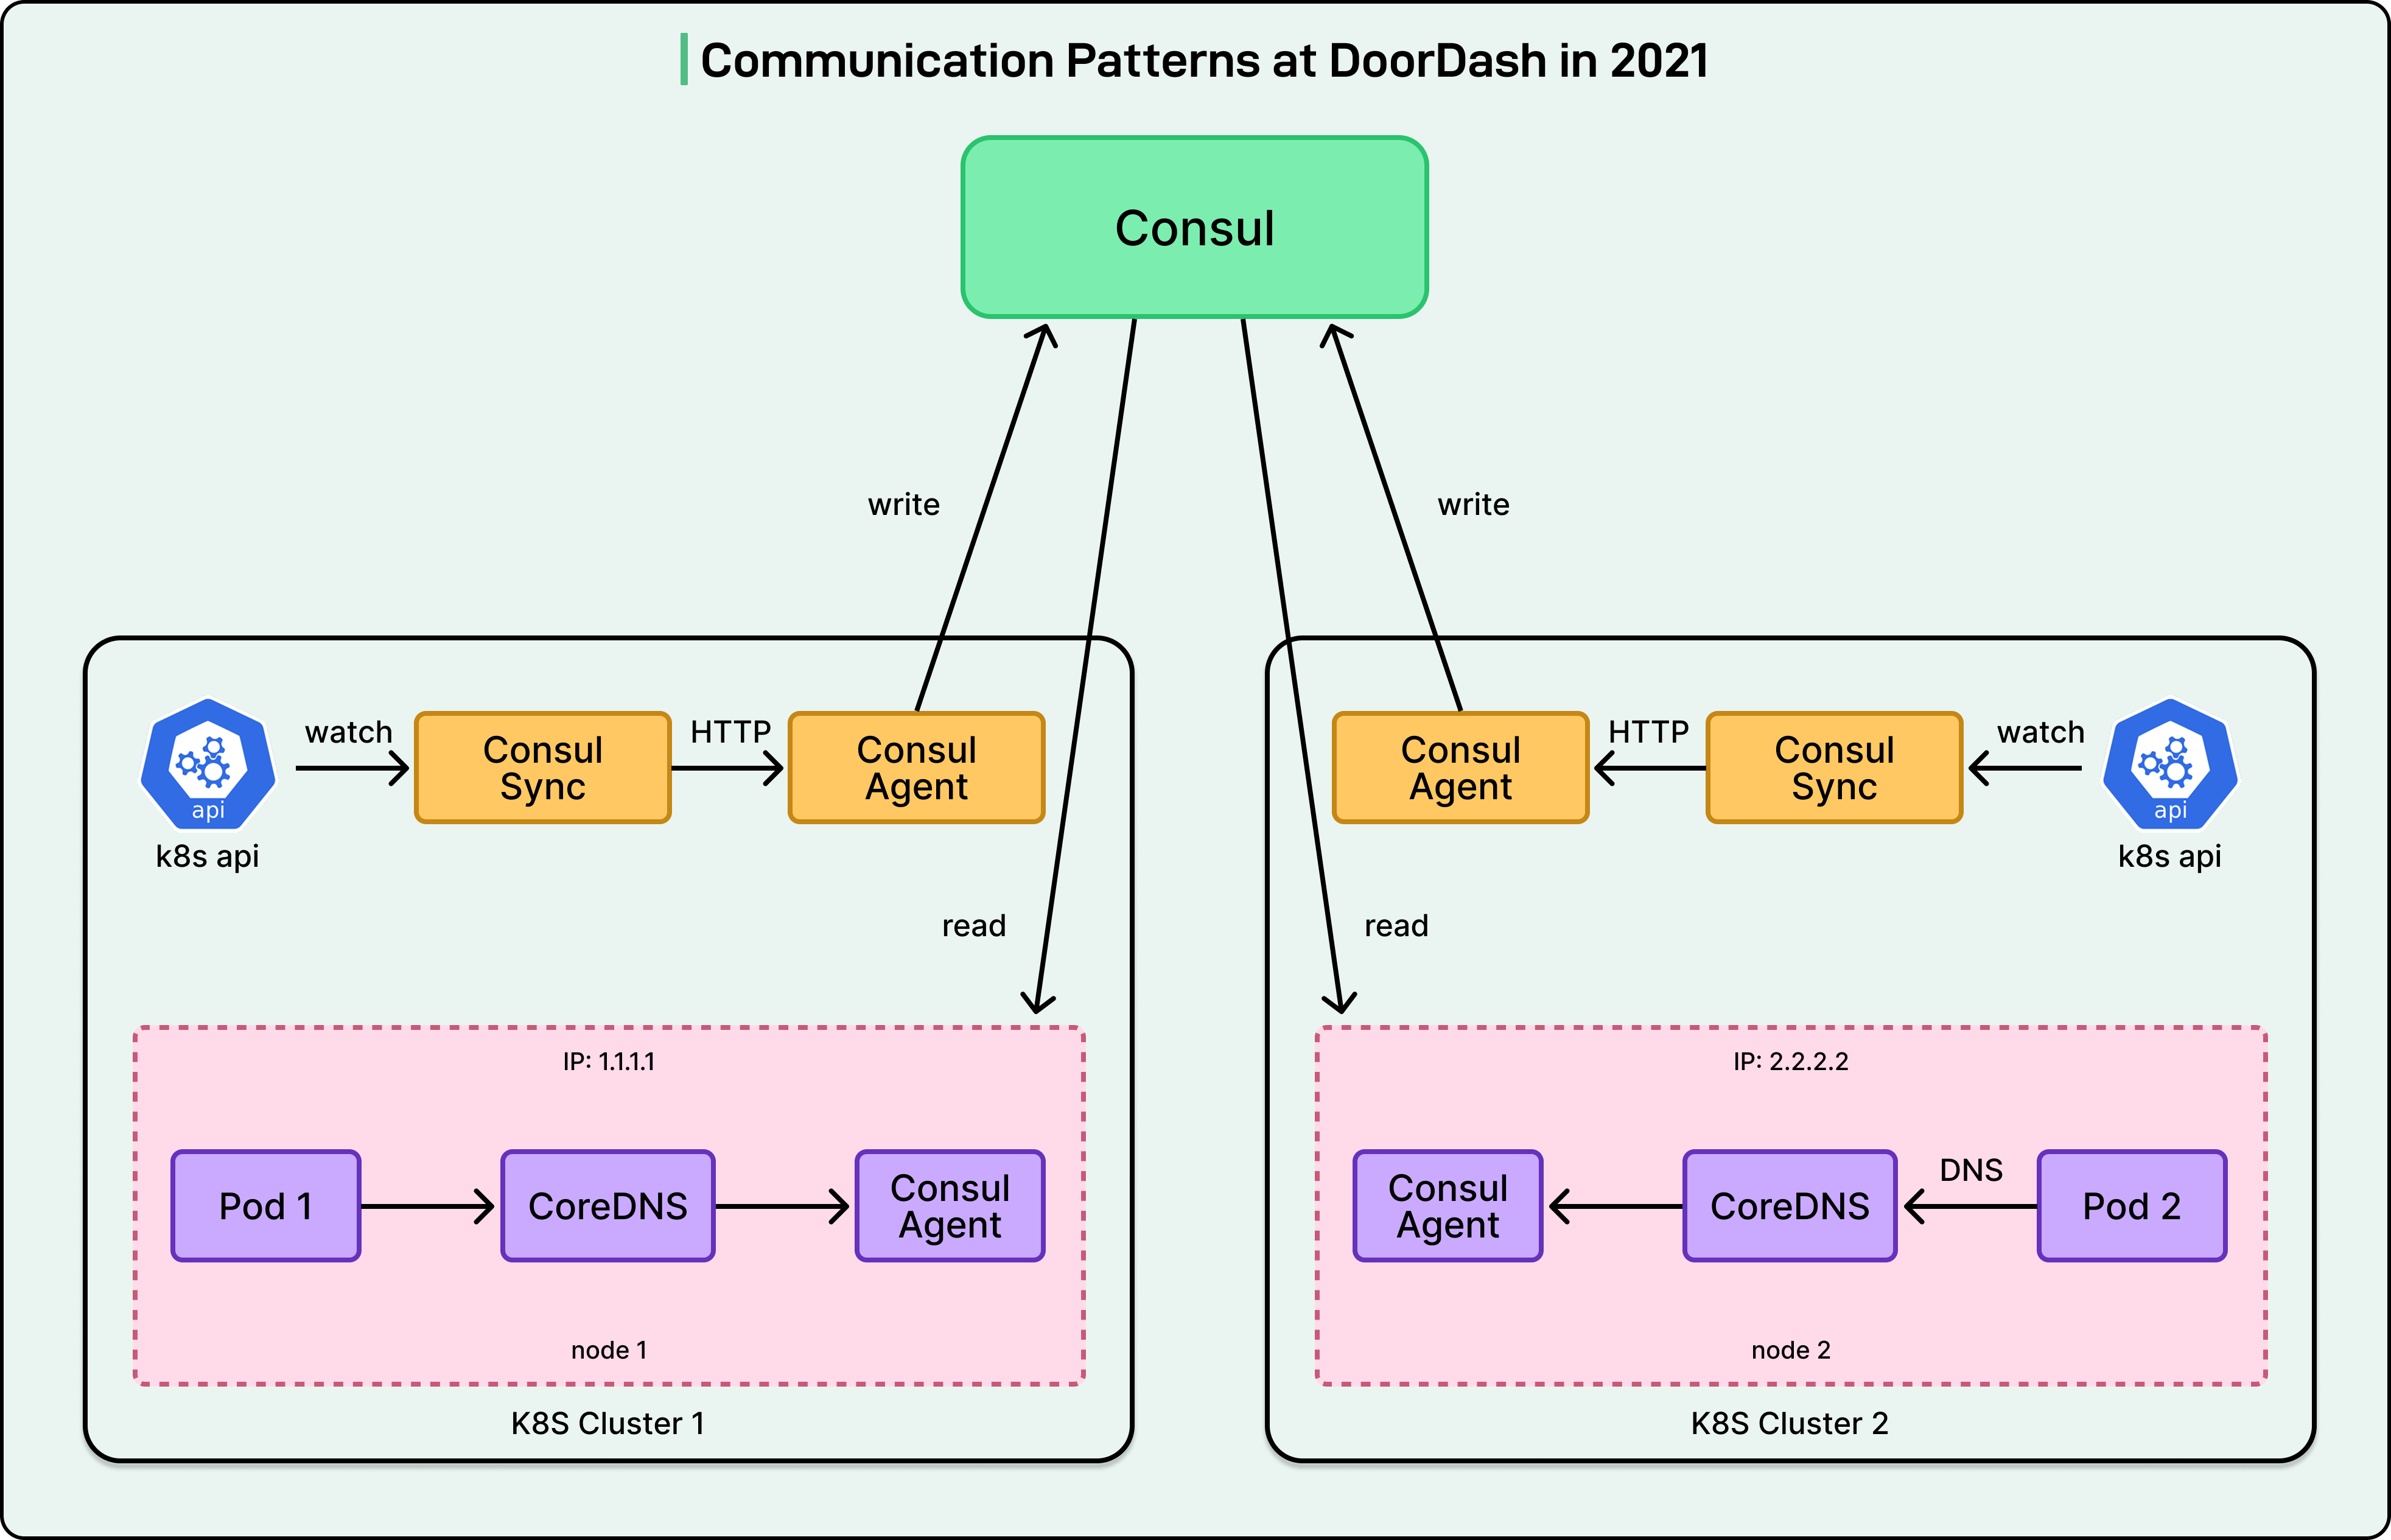
Before the move to Service Mesh, their multi-cluster service discovery architecture looked like this:
Each pod was assigned an elastic IP via AWS CNI to maintain a flat network
A singleton process in each cluster sent the latest pod IPs to a centralized Consul cluster
Clients issued DNS queries through the local CoreDNS DaemonSet
On a cache miss, CoreDNS forwarded to the local Consul agent, which in turn forwarded to the Consul server as needed
See the diagram below:
The service mesh had to integrate seamlessly with this existing setup and accelerate the adoption of this standardized communication model.
The immediate goal was to deliver a minimal feature set to the two major services involved in the outage within three months. The broader goal was to support general onboarding for all services within a total of six months.
Some important concerns were as follows:
Scalability was a primary concern since their single Kubernetes cluster had around 2,000 nodes, approaching the validated limits of many open-source tools. They had already encountered unpredictable scalability issues at the 1,000+ node scale with existing tools and couldn’t afford to introduce another system that would struggle at their size.
Standardization around a unified Consul-based multi-cluster communication model was a key architectural goal to eliminate the fragmentation in their existing setup.
The mesh solution needed to be proven in production and backed by success stories from companies operating at a similar scale. It needed to be stable, well-documented, and easy to configure to minimize operational burden.
The outage mentioned earlier complicated things further. Initially, two engineers from the Core Infrastructure team were exploring service mesh in their spare time. The outage quickly reset their priorities. Rather than aiming for a complete solution, they focused on shipping the most critical reliability features as fast as possible.
Choosing the Service Mesh Solution
The DoorDash engineering team evaluated multiple open-source service mesh solutions, including Istio, Linkerd2, and others, before making their choice. They also spoke with engineers at other companies to learn from their experiences with different service mesh implementations.
The decision ultimately came down to philosophy and trade-offs.
Istio represents the “power user” approach to service mesh. It uses Envoy as its data plane and is extremely feature-rich and flexible, capable of handling virtually any traffic management scenario you might need. However, this power comes at a cost: complexity, a steep learning curve, and heavier resource usage. Istio is designed for large enterprises with dedicated platform teams who can manage its operational burden.
The team rejected Istio due to its complexity, ongoing re-architecture concerns, and operational burden around scalability, debugging, upgrades, and configuration management. With only two engineers initially working on the project, maintaining Istio would have required a much larger team than they could allocate.
Linkerd2 takes a “simplicity first” approach. It uses its own custom lightweight proxy written in Rust and offers a deliberately minimal feature set focused on the essentials. It’s easy to install, operate, and understand, making it attractive for teams wanting “service mesh lite” without operational overhead.
However, there were key reasons to reject Linkerd2 as well:
Features like adaptive concurrency and sophisticated circuit breakers weren’t available out of the box.
Additionally, Linkerd2 would have required upstream contributions to integrate with DoorDash’s existing Consul-based multi-cluster setup, adding development time they didn’t have.
Linkerd also had a smaller community compared to Envoy and Istio, raising concerns about long-term support and ecosystem maturity.
The team ultimately chose Envoy as their data plane because it was battle-tested (originally built by Lyft), performant, and had strong community support. For reference, Envoy has become the de facto standard for service mesh data planes, with most vendors (including Istio) using it under the hood.
Also, rather than adopting a complete service mesh solution, they decided to build a custom control plane tailored to their specific needs. This gave them several advantages:
A minimal custom control plane was faster to build and deploy than learning and operating the full complexity of Istio.
They could implement exactly the reliability features they needed (adaptive concurrency, outlier detection) without unnecessary complexity.
They could integrate directly with their existing Consul-based service discovery without upstream contributions or workarounds.
With just two engineers, a focused custom solution was more manageable than a feature-rich but complex off-the-shelf platform.
The MVP Architecture
The DoorDash engineering team took a pragmatic MVP approach to get things started.
The key aspects of the MVP architecture were as follows:
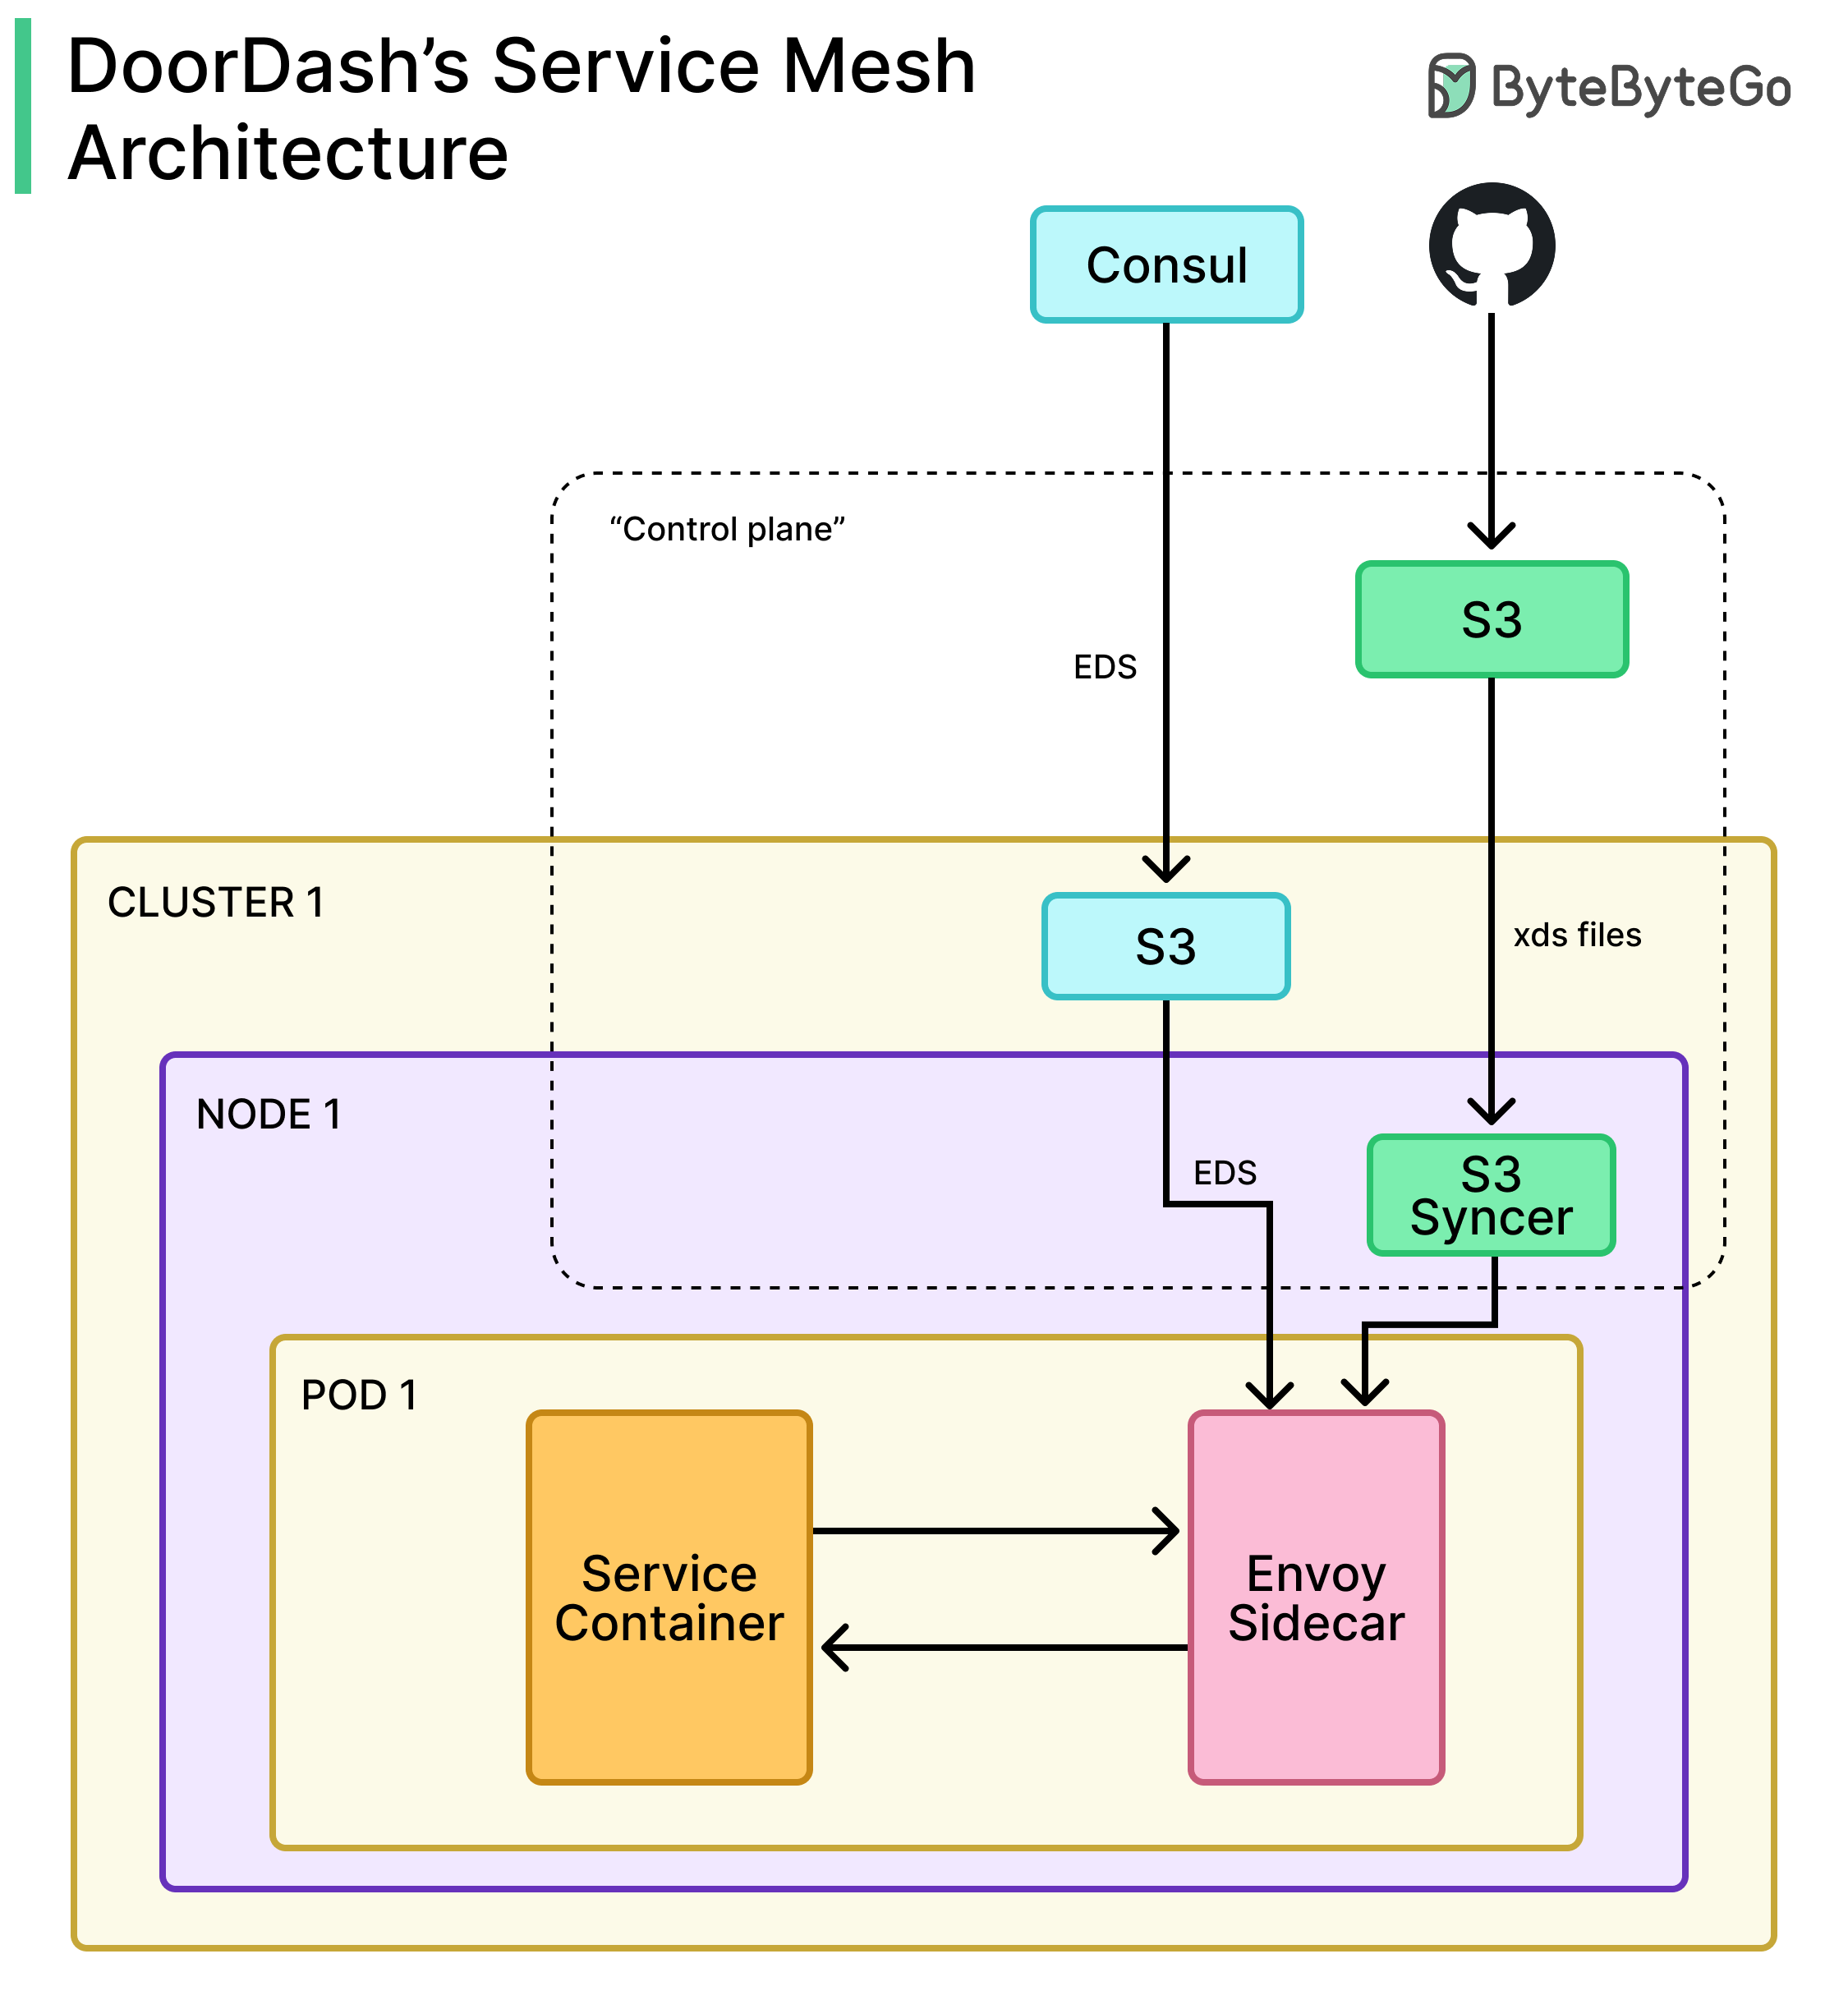
A Kubernetes mutating webhook injected the Envoy sidecar and init containers into pods labeled with “service-mesh-enabled: true”. This made adoption seamless for developers, who simply had to add a label to their deployment, and the mesh infrastructure was automatically injected.
Iptables rules redirected all HTTP/1, HTTP/2, and gRPC traffic through the Envoy sidecar automatically.
Traffic on reserved ports used for non-HTTP protocols bypassed the mesh to avoid interfering with other communication patterns like database connections or message queues.
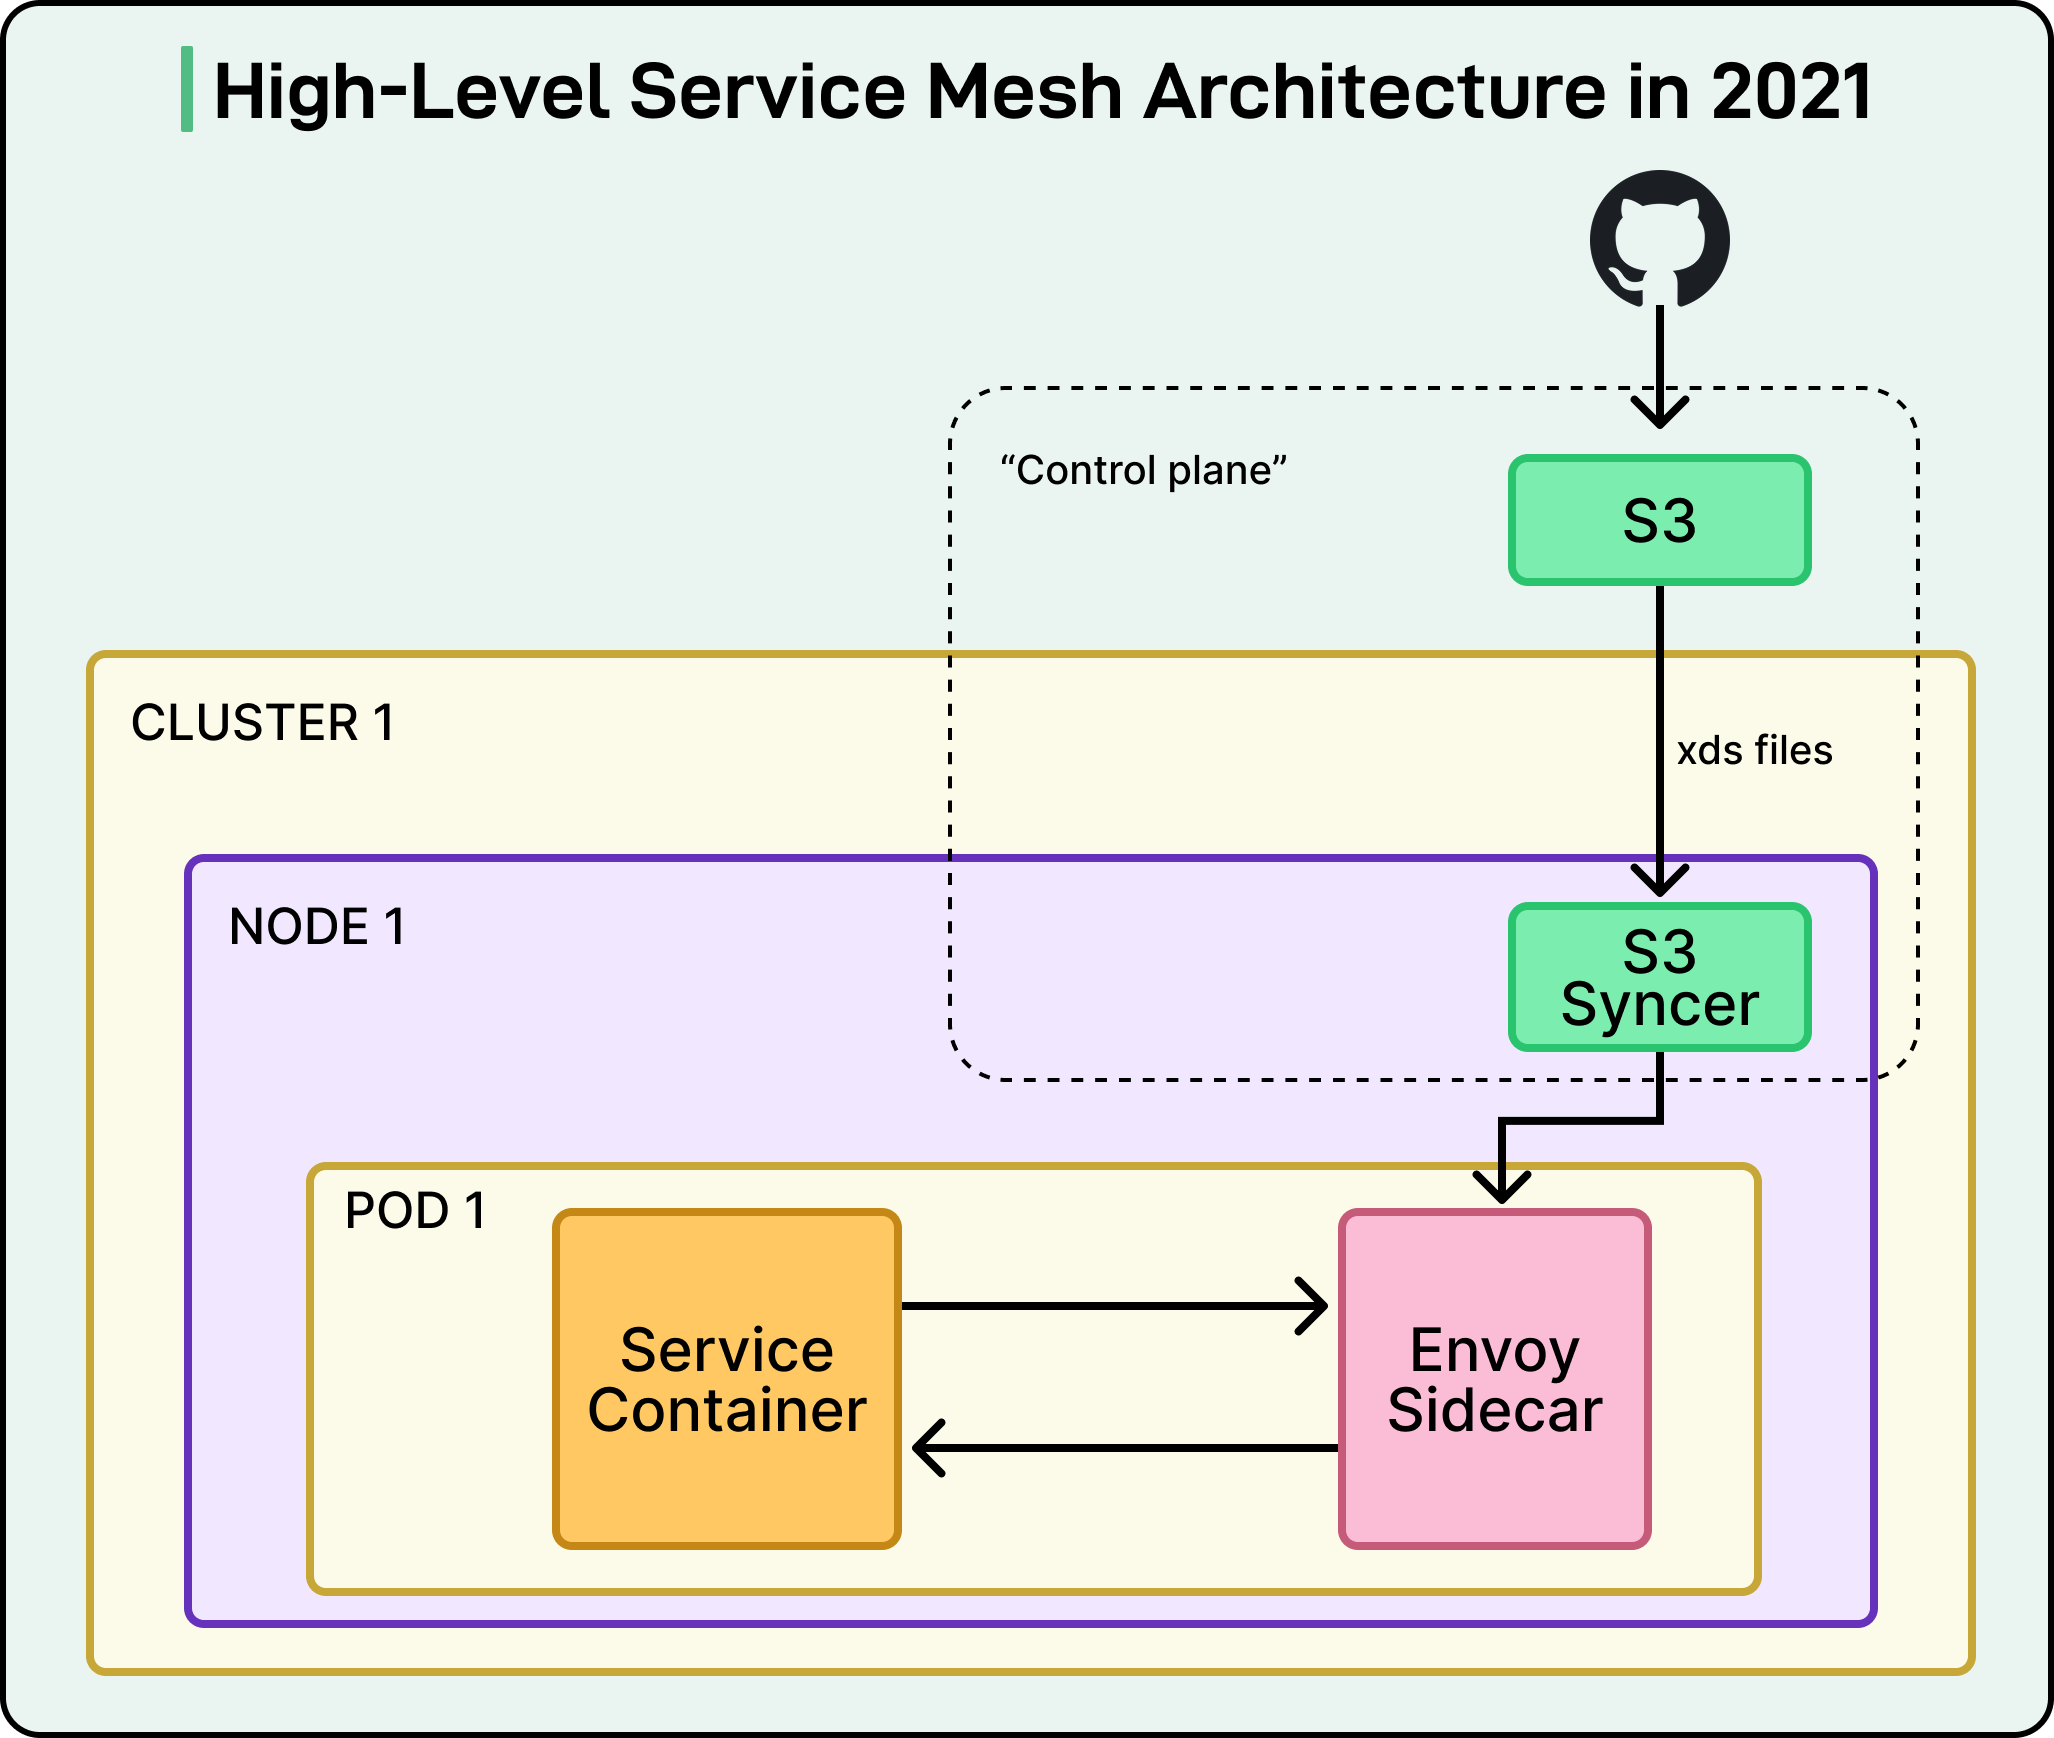
Instead of using a dynamic xDS API configuration, they initially opted for a simpler file-based configuration model. Users wrote raw Envoy configurations in a GitHub repository, which were versioned and reviewed like code through their standard pull request process.
Configurations were packaged and pushed to AWS S3 buckets through the continuous deployment pipeline.
A DaemonSet running on each node pulled configs from S3, extracted them, and mounted them into sidecar containers.
When configurations changed, Envoy would perform a hot-restart, updating its behavior without requiring pod restarts and minimizing downtime.
See the diagram below:
The initial feature set was deliberately minimal, focused only on the reliability problems that caused the outage:
Adaptive concurrency: Automatically limits the number of concurrent requests based on observed latency, preventing overload.
Outlier detection: Identifies and temporarily removes unhealthy service instances from the load balancing pool.
Traffic metrics via Grafana: Provides visibility into request rates, latencies, and error rates at the network layer.
Users manually declared their egress dependencies in configuration files, which allowed the control plane to create dedicated CDS (Cluster Discovery Service) clusters for each upstream service. They used STRICT_DNS as the service discovery type to resolve destination services through DNS lookups against their existing Consul infrastructure.
Critically, the sidecar was configured as an HTTP passthrough proxy, meaning that even undeclared dependencies would still work. If a service made a call to an upstream service that wasn’t explicitly listed in its configuration, the traffic would still reach its destination.
At this stage, they didn’t even call it a “service mesh” internally. It was simply the “Envoy sidecar project”. The configuration model was primitive and lacked a proper control plane in the traditional sense.
However, the goals were clear: establish a working data plane, gain operational experience running Envoy at scale, deliver immediate reliability improvements, demonstrate impact to leadership, secure more resources, and ultimately evolve the architecture into a unified platform they could rely on.
Onboarding Initial Services
The first two services onboarded were critical Python services: the payment service and notification service, which were involved in the outage. By starting with the services that had caused the most pain, the team could directly validate whether the mesh would prevent similar incidents.
Onboarding required just two steps:
Labeling the Kubernetes deployment to trigger sidecar injection
Creating raw Envoy configurations for the service.
While creating raw Envoy configs was still manual at this stage, the process was straightforward enough for the infrastructure team to handle.
The team used a canary deployment approach to introduce the Envoy sidecar gradually and safely. See the diagram below:
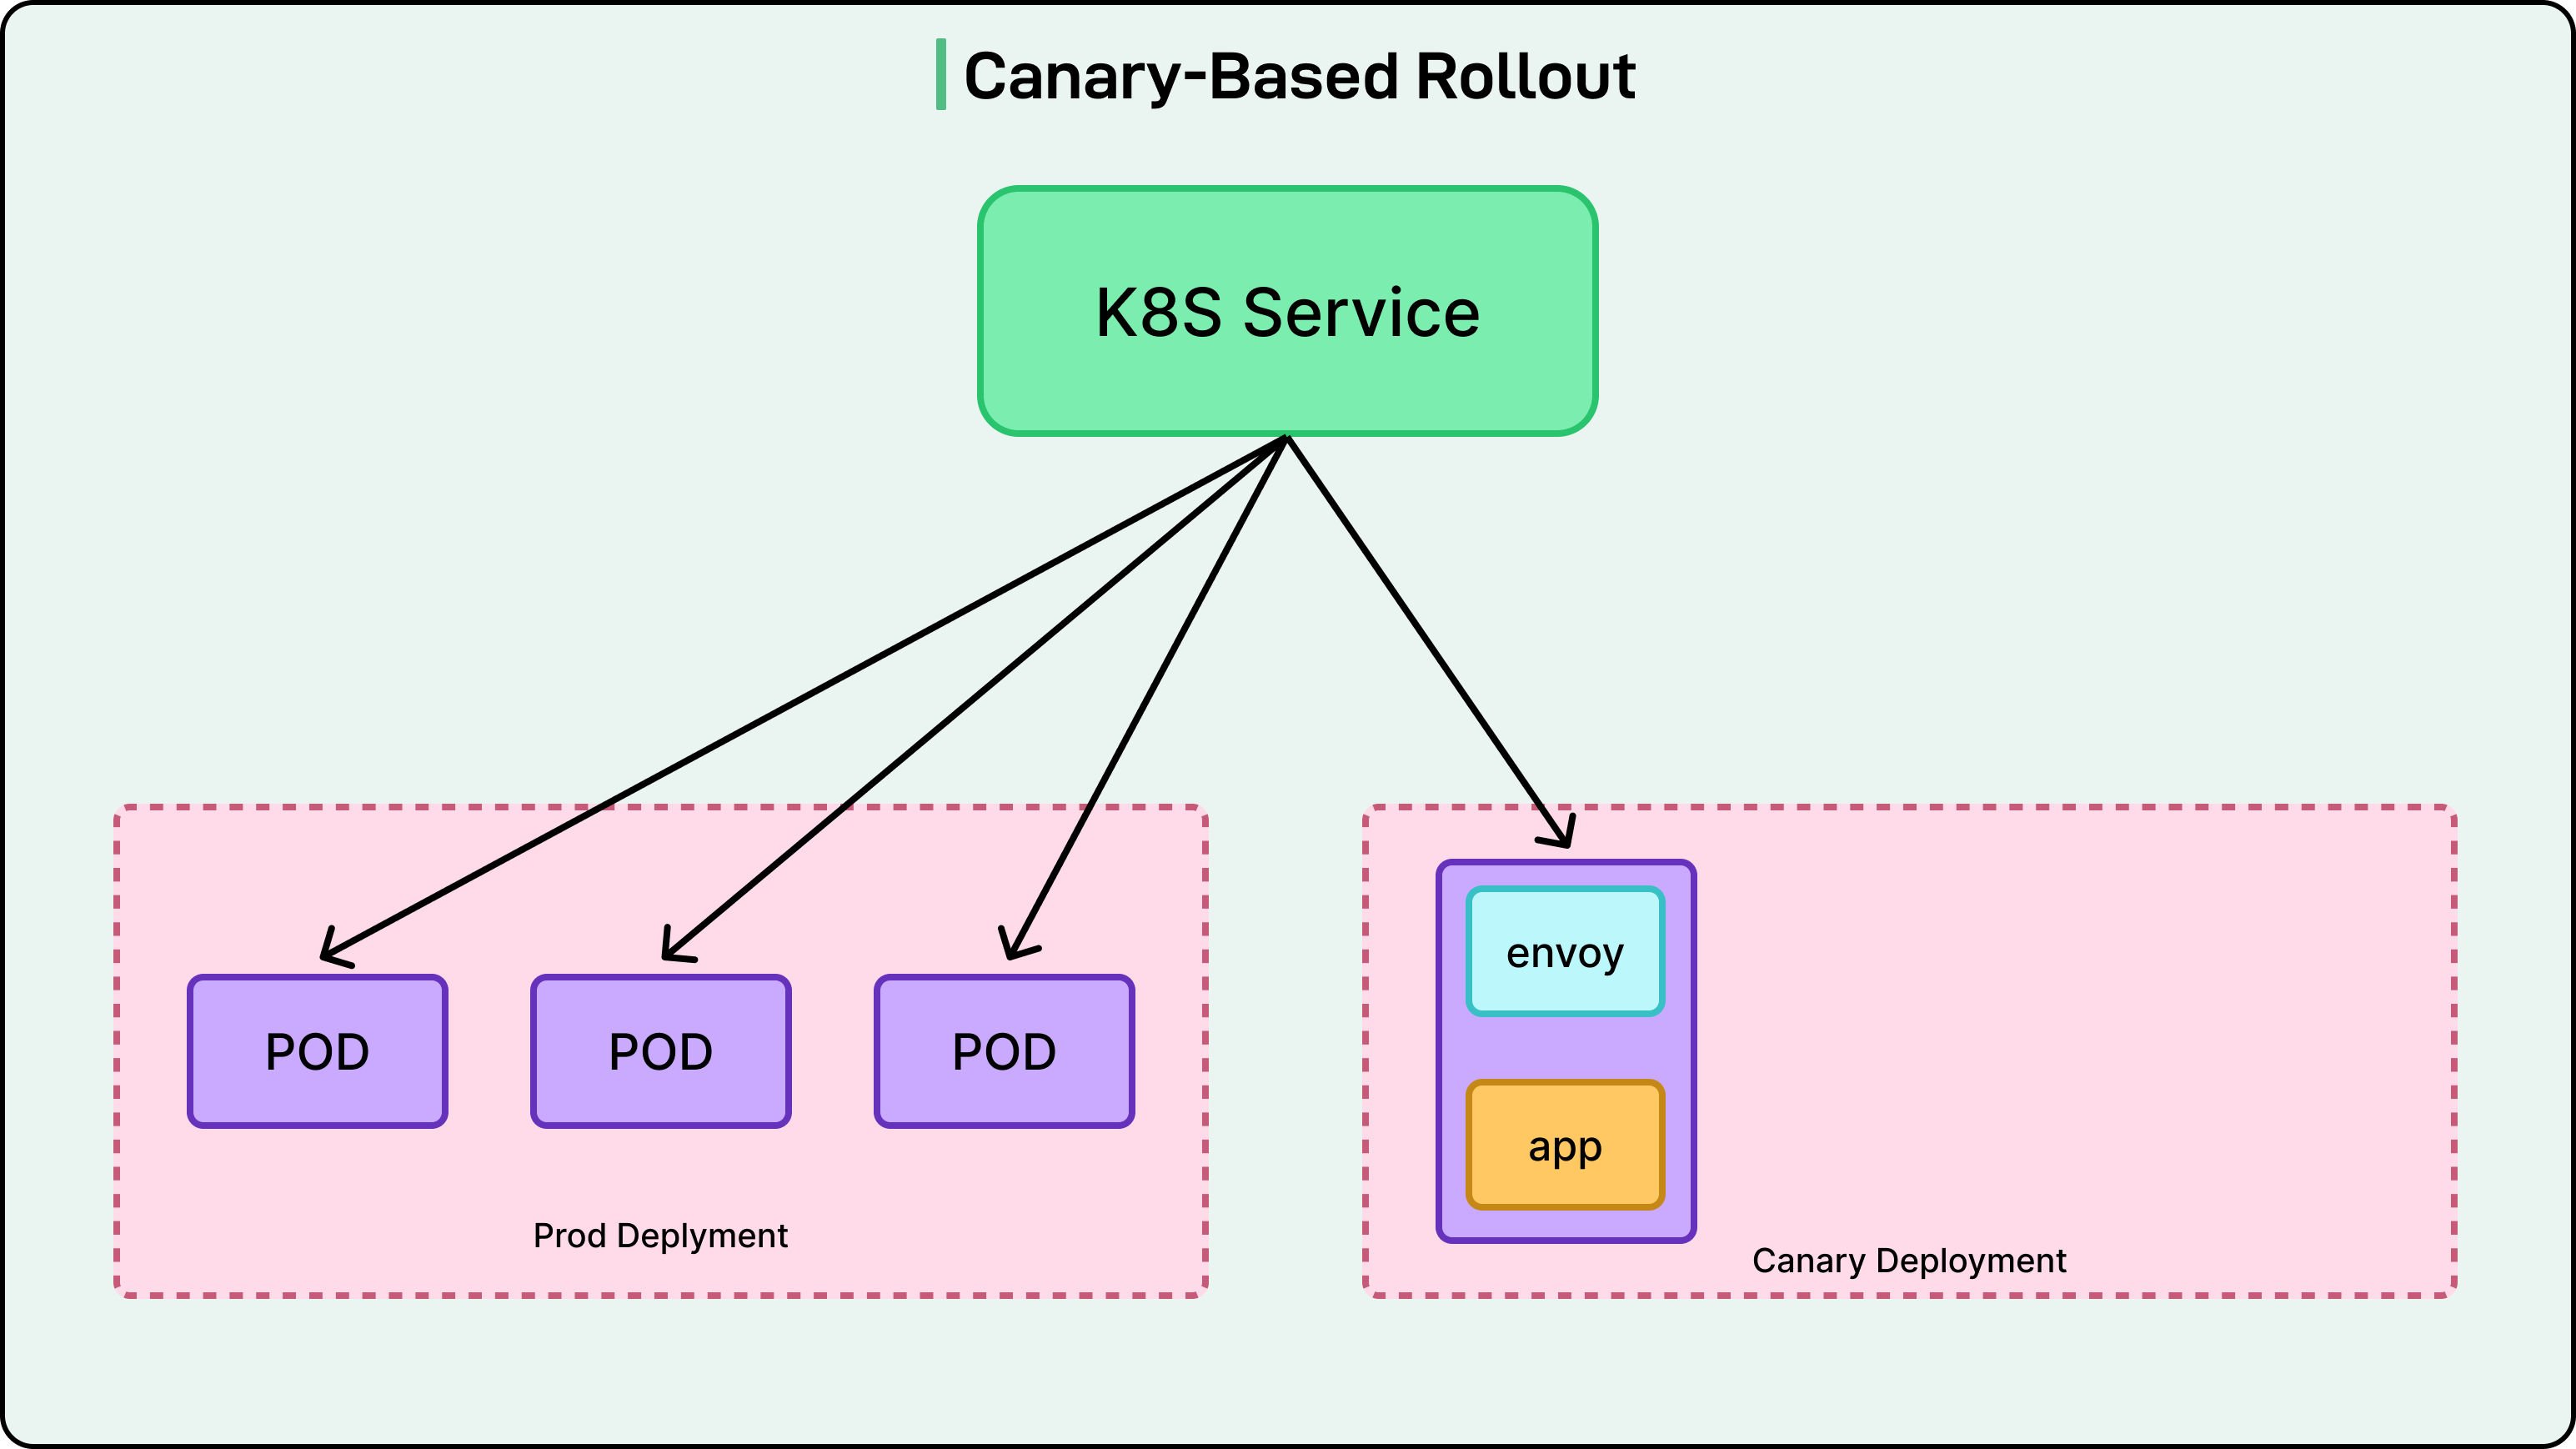
The canary deployment used the same container image as production, but with the service mesh label attached to enable sidecar injection. Importantly, the canary deployment reused labels from the production deployment, so it matched the selectors in the Kubernetes Service object.
This meant that canary pod IPs became automatically routable through all existing service discovery mechanisms (virtual IPs, headless services, nginx-ingress, and Consul DNS). From the perspective of clients calling the payment service, there was no distinction between production pods and canary pods. Traffic was automatically distributed between production and canary pods based on their replica counts.
Developers controlled traffic exposure by adjusting the number of canary replicas. They could start with just one canary pod receiving a small percentage of traffic, observe its behavior, and gradually scale up the canary deployment while scaling down the original production deployment. Once confidence was established, they could update the main production deployment to include the service mesh label and remove the canary entirely.
The rollout happened gradually over two weeks to allow any unknown issues to surface in a controlled manner. The initial onboarding was smooth and successful with no delivery loss.
General Availability
After a successful pilot onboarding, they prepared for general availability by introducing configuration templates.
Templates eliminated the need for developers to manually write raw Envoy configurations, which would have been nearly impossible to do safely at scale. Instead of requiring deep knowledge of Envoy’s configuration syntax, developers could fill in a simple template with their service name, egress dependencies, and basic parameters. The infrastructure team would handle generating the actual Envoy configuration from these templates.
They also provided a centralized Grafana dashboard for networking metrics reported by the Envoy sidecar. This gave all teams a consistent view of their service’s network behavior with data points such as request rates, latencies broken down by percentile, error rates, and connection pool statistics. Shared alert modules and runbooks helped teams respond quickly to common issues like high error rates or increased latency, reducing the learning curve for teams new to operating with the mesh.
With these improvements in place, they officially declared the Envoy sidecar project generally available to all teams.
The combination of automated injection, templated configuration, centralized observability, and operational documentation made it feasible for teams to onboard without requiring deep expertise in Envoy or direct support from the infrastructure team for every migration.
Evolving with Additional Features
As the Service Mesh solution started running in the wild, the internal platform teams started to ask for more features. Some of the key features were as follows:
Zone-Aware Routing
One of the first major feature requests was zone-aware routing, which allowed services to prefer calling instances in the same availability zone, reducing latency and inter-zone bandwidth costs
Zone-aware routing requires Endpoint Discovery Service (EDS) rather than STRICT_DNS for service discovery because it needs detailed metadata about each endpoint, including which availability zone it’s running in. They evolved their configuration management to introduce API-based dynamic configuration for EDS resources.
They developed an xDS control plane that reads IP addresses and availability zone metadata from Consul. The control plane delivered endpoint information to Envoy sidecars via the EDS API in real-time, pushing updates whenever pods were added or removed. This represented a significant architectural shift from purely file-based configuration to a hybrid model mixing files (CDS/LDS) with APIs (EDS).
See the diagram below:

Advanced Routing Capabilities
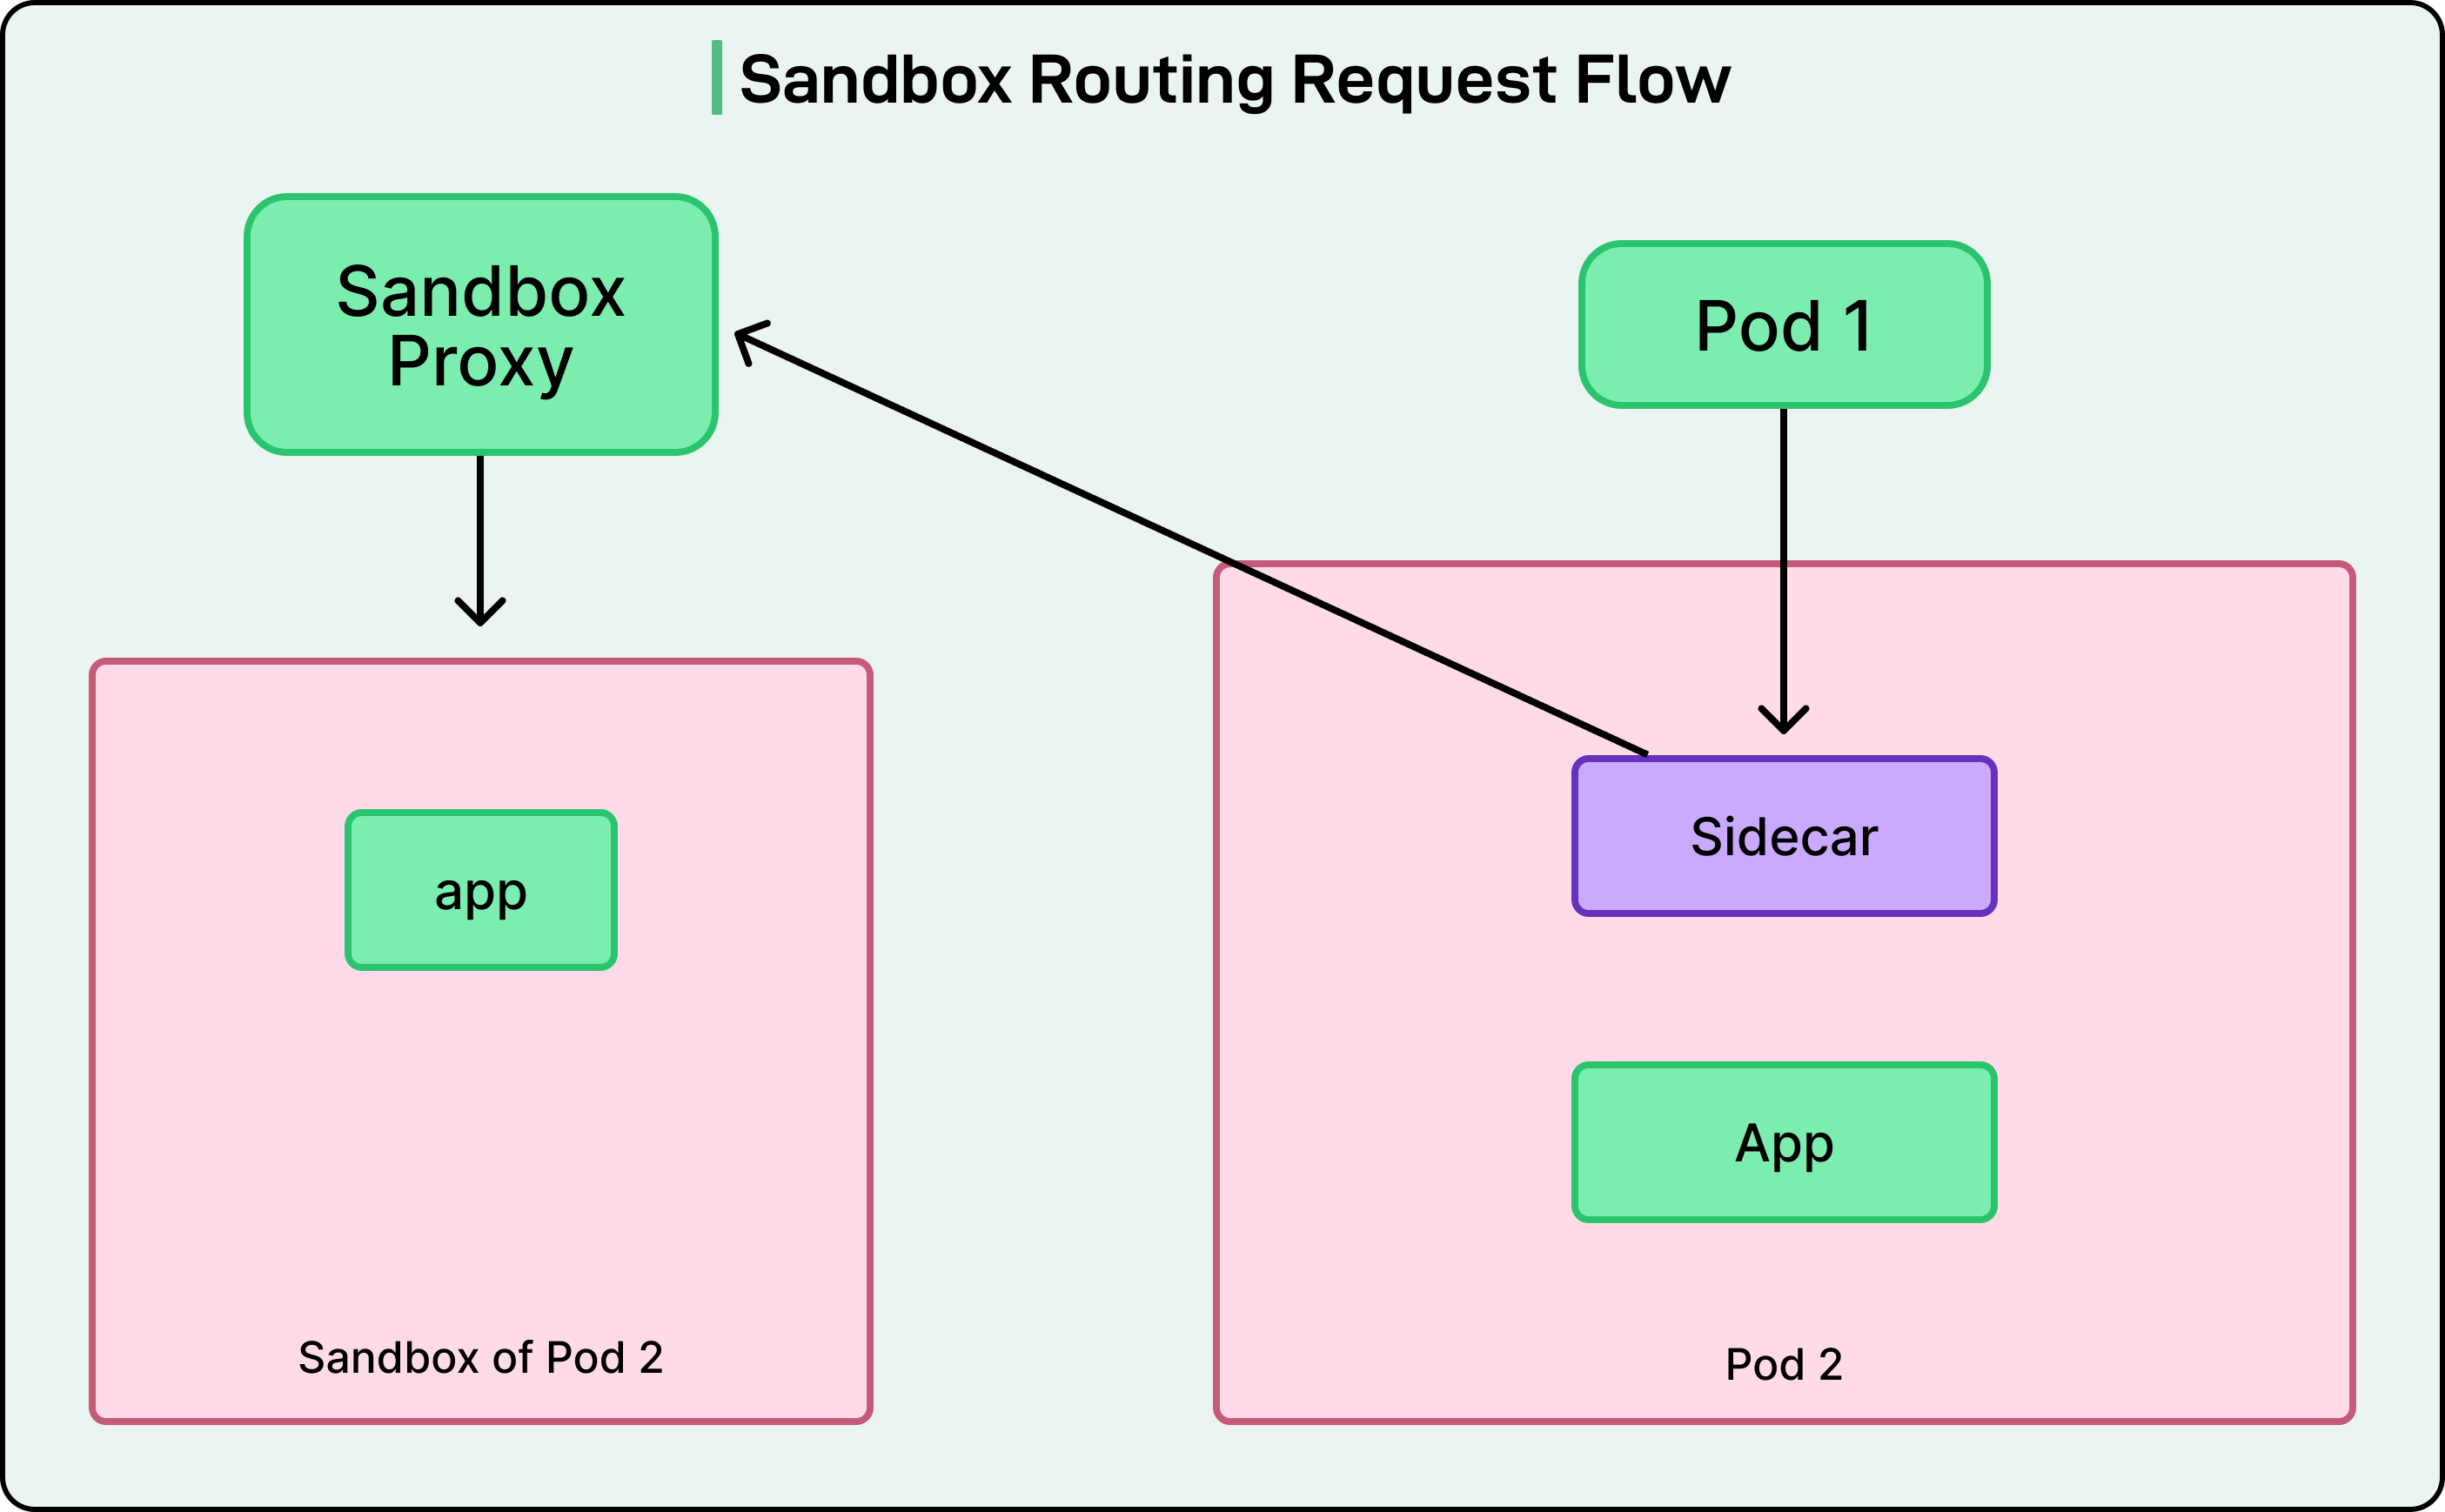
Header-based routing was implemented via Envoy’s route configuration to support more advanced use cases. They partnered with the Test Platform team to enable safe testing in production through sandbox routing.
Sandbox routing allowed ingress traffic to be conditionally redirected to a service’s sandbox version based on HTTP headers. Developers could test new code with production traffic by adding a special header to requests, routing them to experimental instances while normal traffic continued flowing to stable versions.
The Storage team developed an entity cache service to reduce request latency by caching API responses on behalf of clients.
Entity cache routing required the Envoy sidecar to dynamically route egress traffic based on the gRPC method name. Some methods would go to the cache, while others would bypass it. The entity cache implementation included fallback logic to route traffic to origin services when the cache was degraded, ensuring reliability even when the optimization layer failed.
Mass Adoption
After onboarding roughly 100 services, they began preparing for mass onboarding.
The early successes had validated the approach, but the team recognized that the manual processes that worked for 100 services wouldn’t scale to 1,000+. They conducted a thorough review of their onboarding process and post-onboarding support burden to identify bottlenecks and areas for improvement.
Some key points are as follows:
The team began automatically generating Envoy configurations for all services and pre-applying mesh labels to deployments. This significantly reduced the setup burden for each team and ensured consistency from the start. Instead of requiring developers to understand Envoy configuration or even request onboarding, the infrastructure made services mesh-ready by default.
They switched from canary deployments lasting several days to a gradual rolling update-based approach. By rolling update pods cell by cell, leveraging their cell-based architecture for blast radius control, they cut onboarding time from days to under an hour.
To improve debuggability and gain visibility into service dependencies, they integrated OpenTelemetry for distributed tracing. Spot-checking full traces often helped debug incidents, especially when multiple services in a complex graph appeared to fail simultaneously. Instead of piecing together logs from different services, engineers could follow a single request’s journey through the entire system.
The infrastructure team took full responsibility for managing Envoy sidecar resource allocation, including memory and CPU tuning. They removed CPU limits for the Envoy sidecar container to prevent throttling issues that could impact request latency. All pages related to Envoy resource issues were routed to the Infrastructure team, not application developers.
As service mesh became increasingly critical to DoorDash’s infrastructure, they grew the team from around two to eight engineers. They brought in teammates who had previously focused on north-south traffic (external traffic coming into DoorDash) to consolidate ownership of all traffic management
Conclusion
DoorDash’s service mesh journey demonstrates that successful infrastructure transformations require more than just adopting the right technology. They started with a real problem (cascading failures causing platform-wide outages) and built a solution incrementally, proving value at each step before expanding scope.
Several key lessons emerge from their experience.
Most important is to stay grounded in real problems rather than chasing architectural trends. Service mesh is complex, spanning many infrastructure domains, so focus on the specific issues it can solve for your organization. Also, expect the unexpected. The additional Envoy proxy can introduce subtle behaviors that are difficult to debug. This is where it becomes important to start small with pilot teams and test incrementally to surface edge cases early.
Move fast when it matters. DoorDash shipped a minimal MVP in three months because preventing the next outage was urgent. Sometimes shipping early, even with imperfections, unlocks long-term progress. However, recognize that manual processes don’t scale. Automate onboarding and operations wherever possible to avoid bottlenecks during mass adoption.
Developer experience matters critically. Education is essential but not scalable, and therefore, it is important to make things intuitive by design and invest in UX-focused tools.
References:
SPONSOR US
Get your product in front of more than 1,000,000 tech professionals.
Our newsletter puts your products and services directly in front of an audience that matters - hundreds of thousands of engineering leaders and senior engineers - who have influence over significant tech decisions and big purchases.
Space Fills Up Fast - Reserve Today
Ad spots typically sell out about 4 weeks in advance. To ensure your ad reaches this influential audience, reserve your space now by emailing sponsorship@bytebytego.com.