
How LinkedIn Built a Next-Gen Service Discovery for 1000s of Services

Your free ticket to Monster SCALE Summit is waiting — 50+ engineering talks on data-intensive applications (Sponsored)

Monster SCALE Summit is a virtual conference all about extreme-scale engineering and data-intensive applications. Engineers from Discord, Disney, LinkedIn, Uber, Pinterest, Rivian, ClickHouse, Redis, MongoDB, ScyllaDB + more will be sharing 50+ talks on topics like:
Distributed databases
Streaming and real-time processing
Intriguing system designs
Approaches to a massive scaling challenge
Methods for balancing latency/concurrency/throughput
Infrastructure built for unprecedented demands.
Don’t miss this chance to connect with 20K of your peers designing, implementing, and optimizing data-intensive applications – for free, from anywhere.
LinkedIn serves hundreds of millions of members worldwide, delivering fast experiences whether someone is loading their feed or sending a message. Behind the scenes, this seamless experience depends on thousands of software services working together. Service Discovery is the infrastructure system that makes this coordination possible.
Consider a modern application at scale. Instead of building one massive program, LinkedIn breaks functionality into tens of thousands of microservices. Each microservice handles a specific task like authentication, messaging, or feed generation. These services need to communicate with each other constantly, and they need to know where to find each other.
Service discovery solves this location problem. Instead of hardcoding addresses that can change as servers restart or scale, services use a directory that tracks where every service currently lives. This directory maintains IP addresses and port numbers for all active service instances.
At LinkedIn’s scale, with tens of thousands of microservices running across global data centers and handling billions of requests each day, service discovery becomes exceptionally challenging. The system must update in real time as servers scale up or down, remain highly reliable, and respond within milliseconds.
In this article, we learn how LinkedIn built and rolled out Next-Gen Service Discovery, a scalable control plane supporting app containers in multiple programming languages.
Disclaimer: This post is based on publicly shared details from the LinkedIn Engineering Team. Please comment if you notice any inaccuracies.
Zookeeper-Based Architecture
For the past decade, LinkedIn used Apache Zookeeper as the control plane for service discovery. Zookeeper is a coordination service that maintains a centralized registry of services.
In this architecture, Zookeeper allows server applications to register their endpoint addresses in a custom format called D2, which stands for Dynamic Discovery. The system stored the configuration about how RPC traffic should flow as D2 configs and served them to application clients. The application servers and clients formed the data plane, handling actual inbound and outbound RPC traffic using LinkedIn’s Rest.li framework, a RESTful communication system.
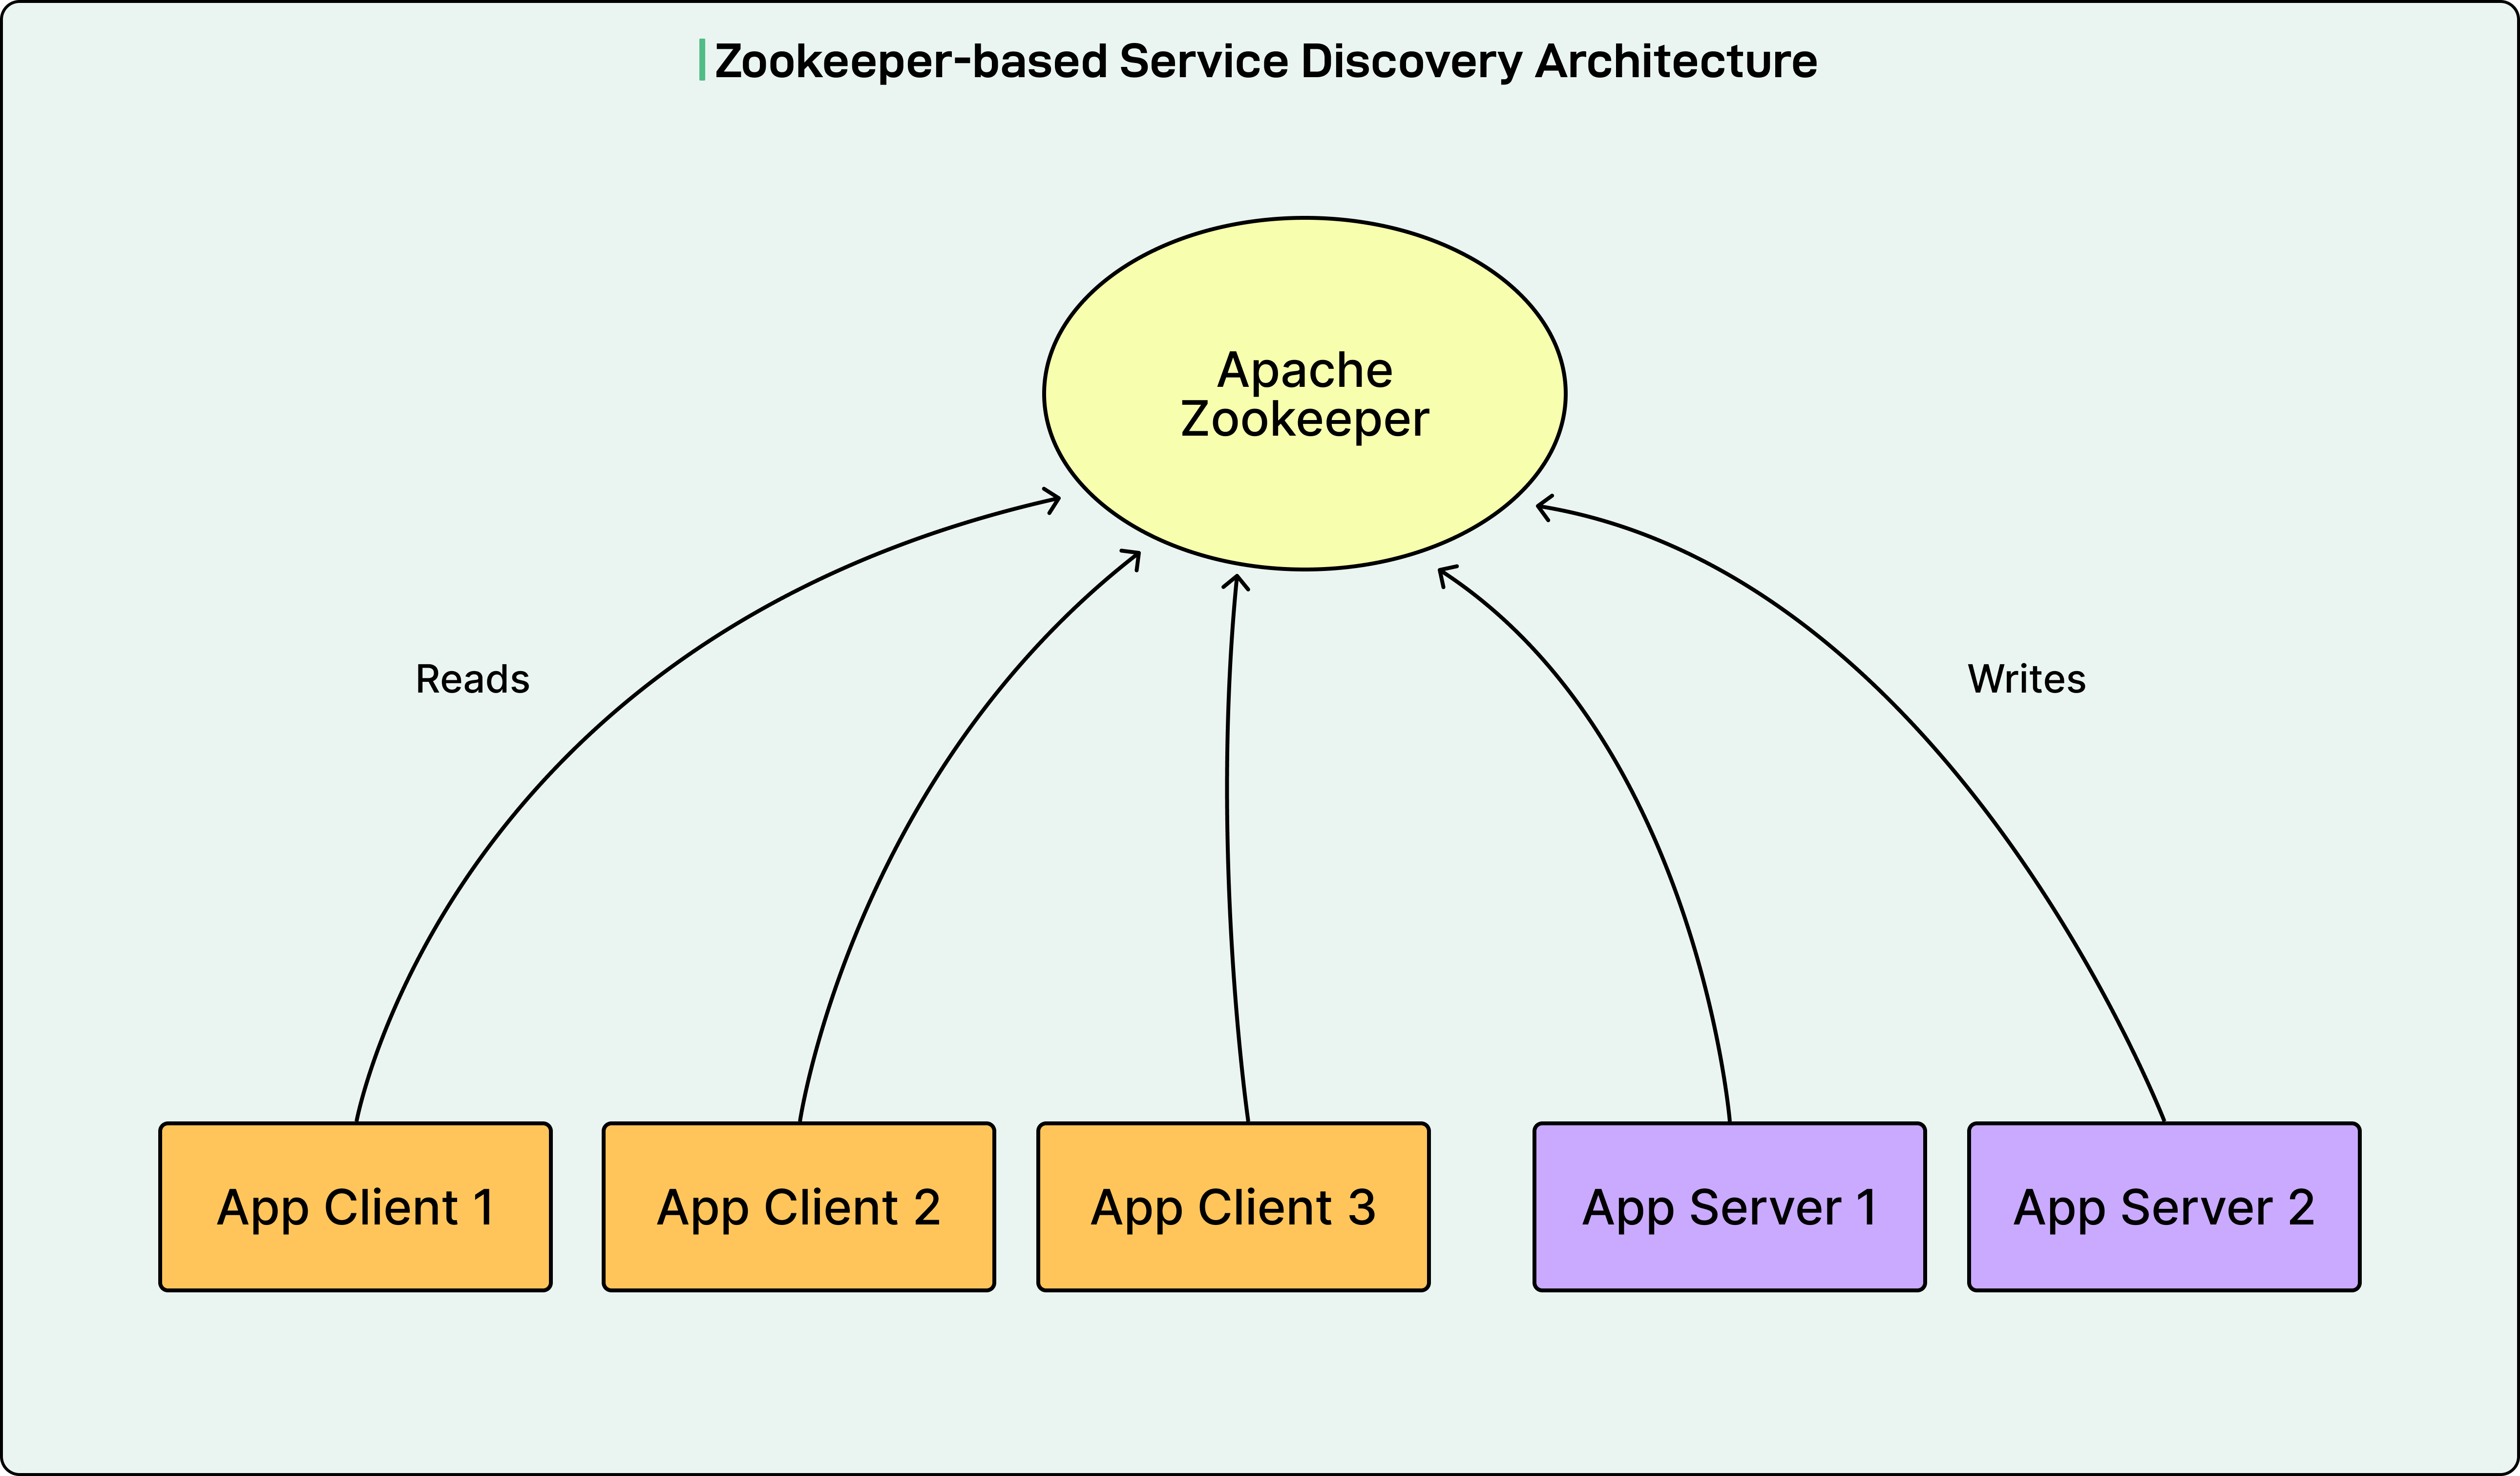
Here is how the system worked:
The Zookeeper client library ran on all application servers and clients.
The Zookeeper ensemble took direct write requests from application servers to register their endpoint addresses as ephemeral nodes called D2 URIs.
Ephemeral nodes are temporary entries that exist only while the connection remains active.
The Zookeeper performed health checks on these connections to keep the ephemeral nodes alive.
The Zookeeper also took direct read requests from application clients to set watchers on the server clusters they needed to call. When updates happened, clients would read the changed ephemeral nodes.
Despite its simplicity, this architecture had critical problems in three areas: scalability, compatibility, and extensibility. Benchmark tests conducted in the past projected that the system would reach capacity in early 2025.
Web Search API for your AI applications (Sponsored)

LLMs are powerful—but without fresh, reliable information, they hallucinate, miss context, and go out of date fast. SerpApi gives your AI applications clean, structured web data from major search engines and marketplaces, so your agents can research, verify, and answer with confidence.
Access real-time data with a simple API.
Critical Problems with Zookeeper
The key problems with Zookeeper are as follows:
1 - Scalability Issues
The control plane operated as a flat structure handling requests for hundreds of thousands of application instances.
During deployments of large applications with many calling clients, the D2 URI ephemeral nodes changed frequently. This led to read storms with huge fanout from all the clients trying to read updates simultaneously, causing high latencies for both reads and writes.
Zookeeper is a strong consistency system, meaning it enforces strict ordering over availability. All reads, writes, and session health checks go through the same request queue. When the queue had a large backlog of read requests, write requests could not be processed. Even worse, all sessions would be dropped due to health check timeouts because the queue was too backed up. This caused ephemeral nodes to be removed, resulting in capacity loss of application servers and site unavailability.
The session health checks performed on all registered application servers became unscalable with fleet growth. As of July 2022, LinkedIn had about 2.5 years of capacity left with a 50 to 100 percent yearly growth rate in cluster size and number of watchers, even after increasing the number of Zookeeper hosts to 80.
2 - Compatibility Problems
Since D2 entities used LinkedIn’s custom schemas, they were incompatible with modern data plane technologies like gRPC and Envoy.
The read and write logic in application containers was implemented primarily in Java, with a partial and outdated implementation for Python applications. When onboarding applications in other languages, the entire logic needed to be rewritten from scratch.
3 - Extensibility Limitations
The lack of an intermediary layer between the service registry and application instances prevented the development of modern centralized RPC management techniques like centralized load balancing.
It also created challenges for integrating with new service registries to replace Zookeeper, such as Etcd with Kubernetes, or any new storage system that might have better functionality or performance.
The Next-Gen Service Discovery Architecture
The LinkedIn Engineering Team designed the new architecture to address all these limitations. Unlike Zookeeper handling read and write requests together, Next-Gen Service Discovery consists of two separate paths: Kafka for writes and Service Discovery Observer for reads.
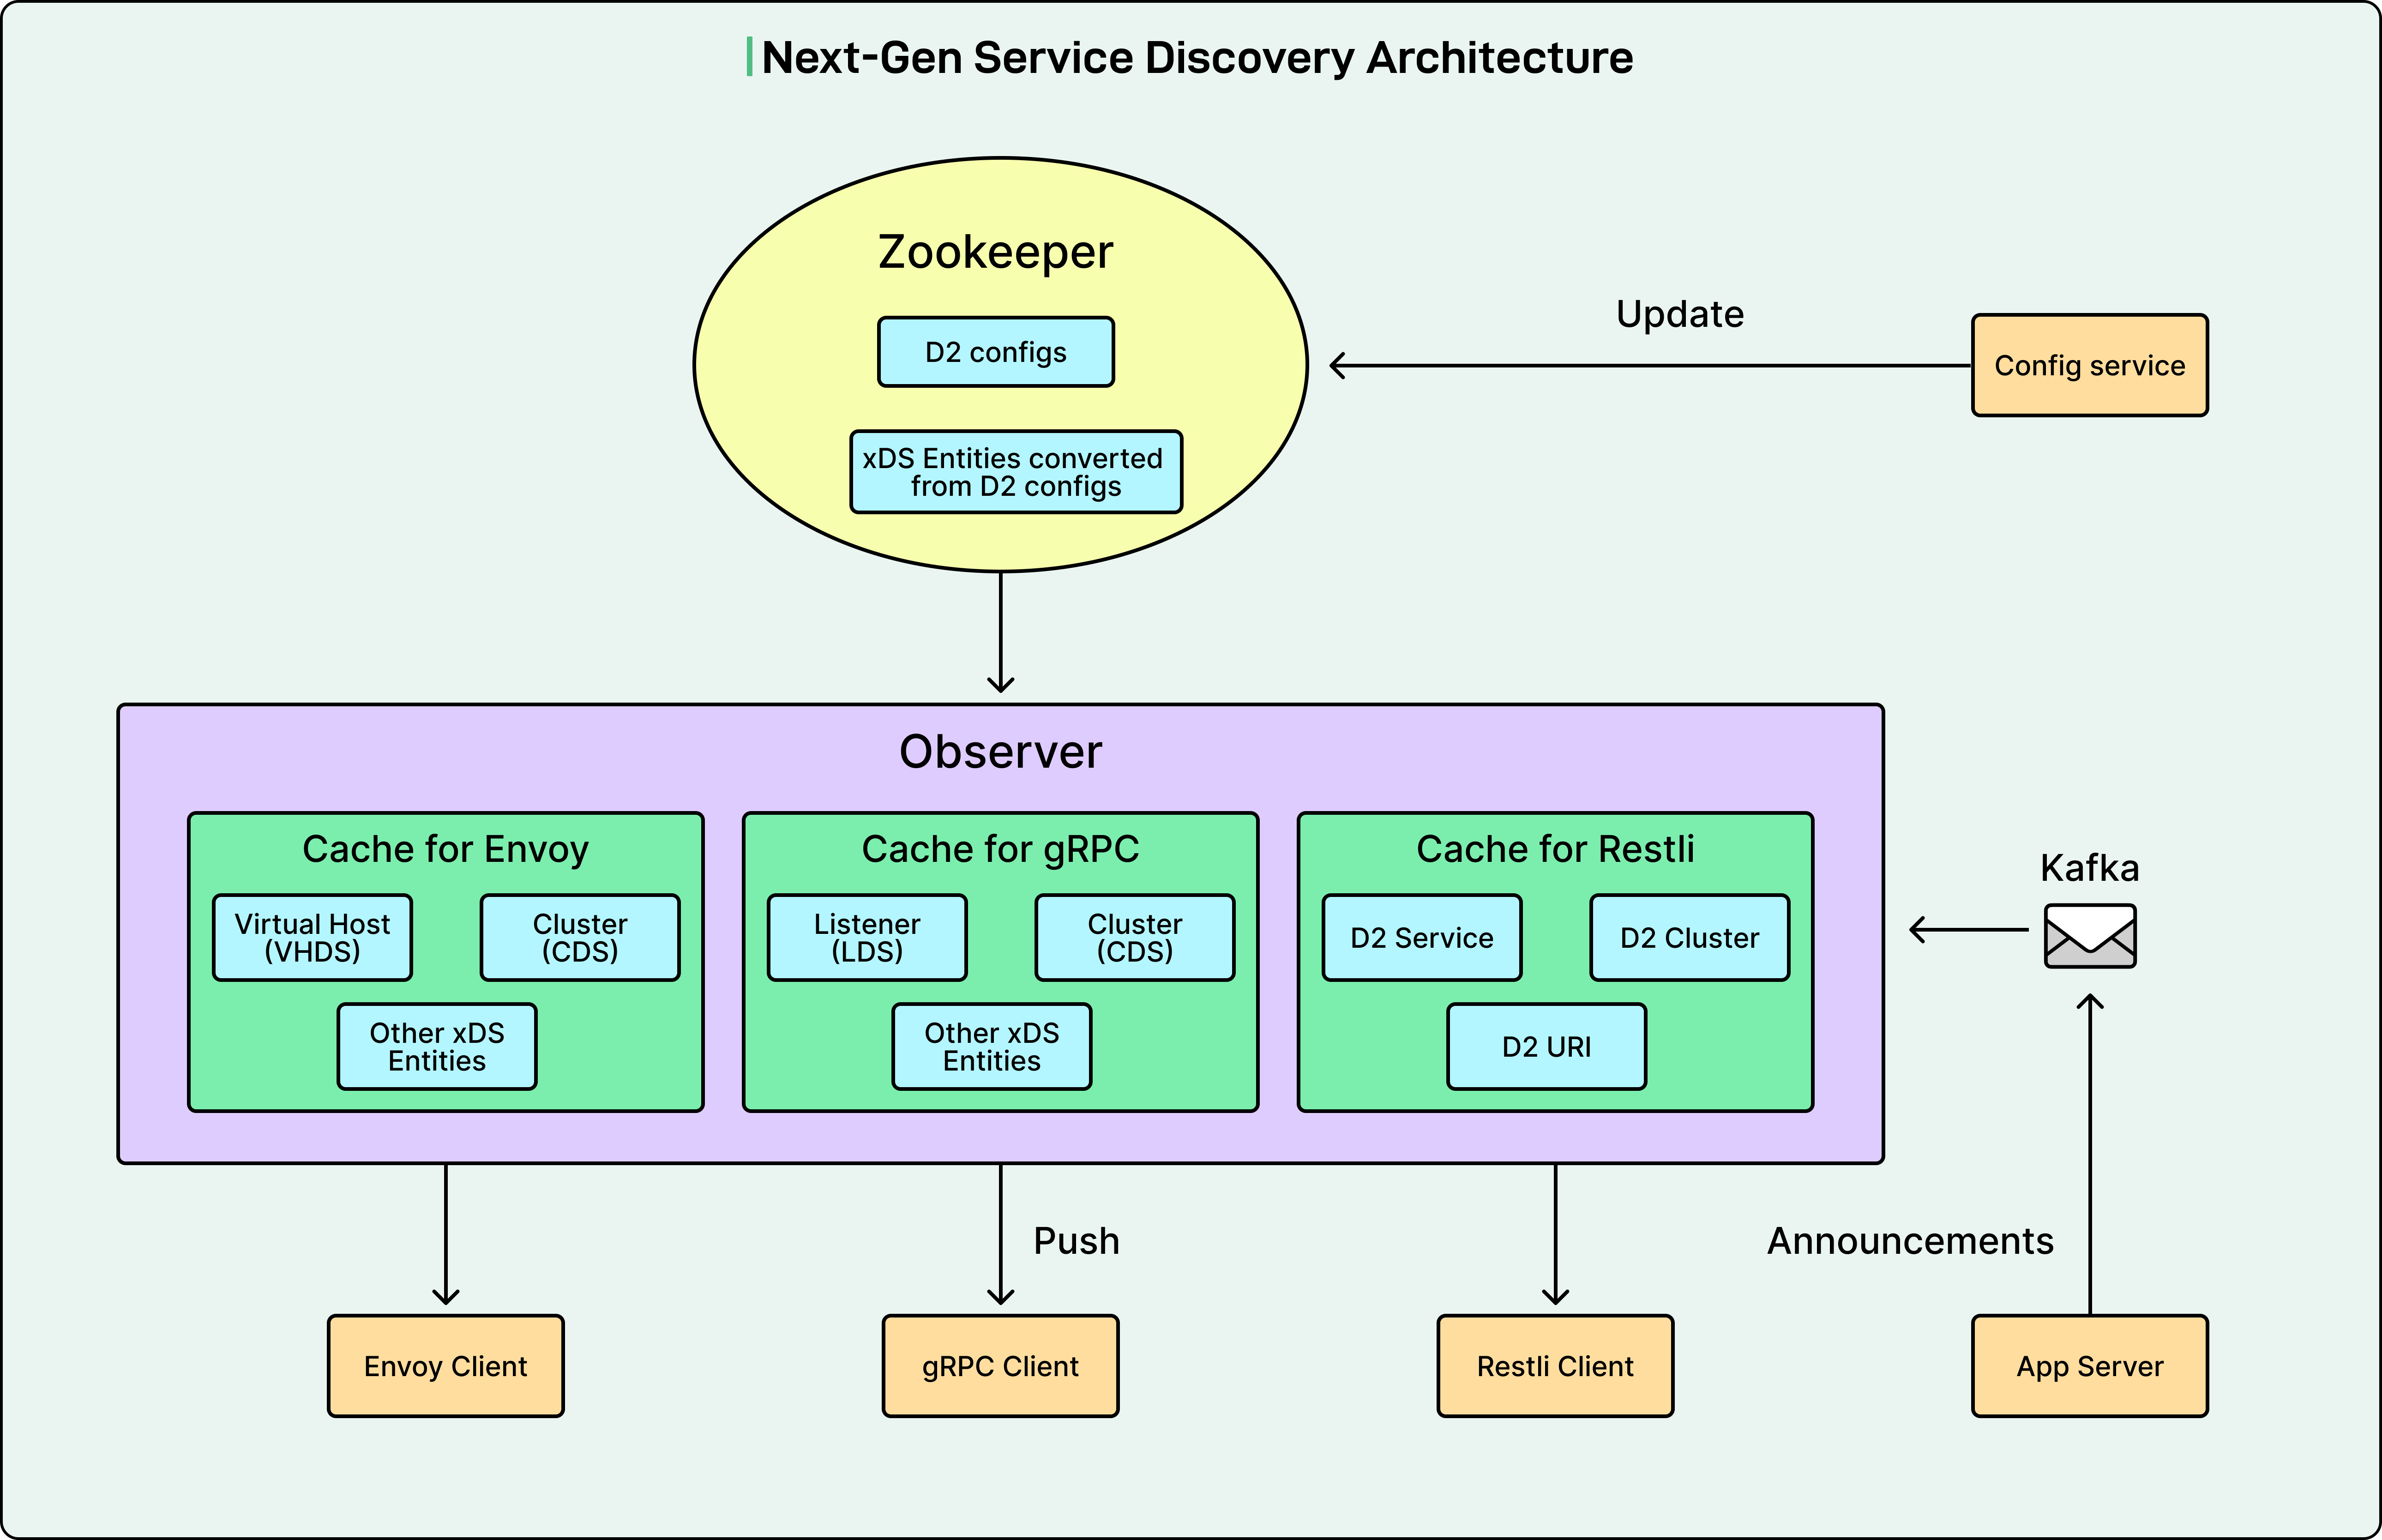
1 - The Write Path
Kafka takes in application server writes and periodic heartbeats through Kafka events called Service Discovery URIs. Kafka is a distributed streaming platform capable of handling millions of messages per second. Each Service Discovery URI contains information about a service instance, including service name, IP address, port number, health status, and metadata.
2 - The Read Path
Service Discovery Observer consumes the URIs from Kafka and writes them into its main memory. Application clients open bidirectional gRPC streams to the Observer, sending subscription requests using the xDS protocol. The Observer keeps these streams open to push data and all subsequent updates to application clients instantly.
The xDS protocol is an industry standard created by the Envoy project for service discovery. Instead of clients polling for updates, the Observer pushes changes as they happen. This streaming approach is far more efficient than the old polling model.
3 - Configuration Management
D2 configs remain stored in Zookeeper. Application owners run CLI commands to leverage Config Service to update the D2 configs and convert them into xDS entities.
Observer consumes the configs from Zookeeper and distributes them to clients the same way as the URIs.
4 - The Observer Component
The Observer is horizontally scalable and written in Go, chosen for its high concurrency capabilities.
It can process large volumes of client requests, dispatch data updates, and consume URIs for the entire LinkedIn fleet efficiently. As of today, one Observer can maintain 40,000 client streams while sending 10,000 updates per second and consuming 11,000 Kafka events per second.
With projections of fleet size growing to 3 million instances in the coming years, LinkedIn will need approximately 100 Observers.
Key Improvements Over Zookeeper
Here are some key improvements that the new architecture provided in comparison to Zookeeper:
Scalability and Availability
LinkedIn prioritized availability over consistency because service discovery data only needs to eventually converge. Some short-term inconsistency across servers is acceptable, but the data must be highly available to the huge fleet of clients. This represents a fundamental shift from Zookeeper’s strong consistency model.
Multiple Observer replicas reach eventual consistency after a Kafka event is consumed and processed on all replicas. Even when Kafka experiences significant lag or goes down, Observer continues serving client requests with its cached data, preventing cascading failures.
LinkedIn can further improve scalability by separating dedicated Observer instances. Some Observers can focus on consuming Kafka events as consumers, while other Observers serve client requests as servers. The server Observers would subscribe to the consumer Observers for cache updates.
Compatibility with Modern Tools
Next-Gen Service Discovery supports the gRPC framework natively and enables multi-language support.
Since the control plane uses the xDS protocol, it works with open-source gRPC and Envoy proxy. Applications not using Envoy can leverage open-source gRPC code to directly subscribe to the Observer. Applications onboarding the Envoy proxy get multi-language support automatically.
Extensibility for Future Features
Adding Next-Gen Service Discovery as a central control plane between the service registry and clients enables LinkedIn to extend to modern service mesh features. These include centralized load balancing, security policies, and transforming endpoint addresses between IPv4 and IPv6.
LinkedIn can also integrate the system with Kubernetes to leverage application readiness probes. This would collect the status and metadata of application servers, converting servers from actively making announcements to passively receiving status probes, which is more reliable and better managed.
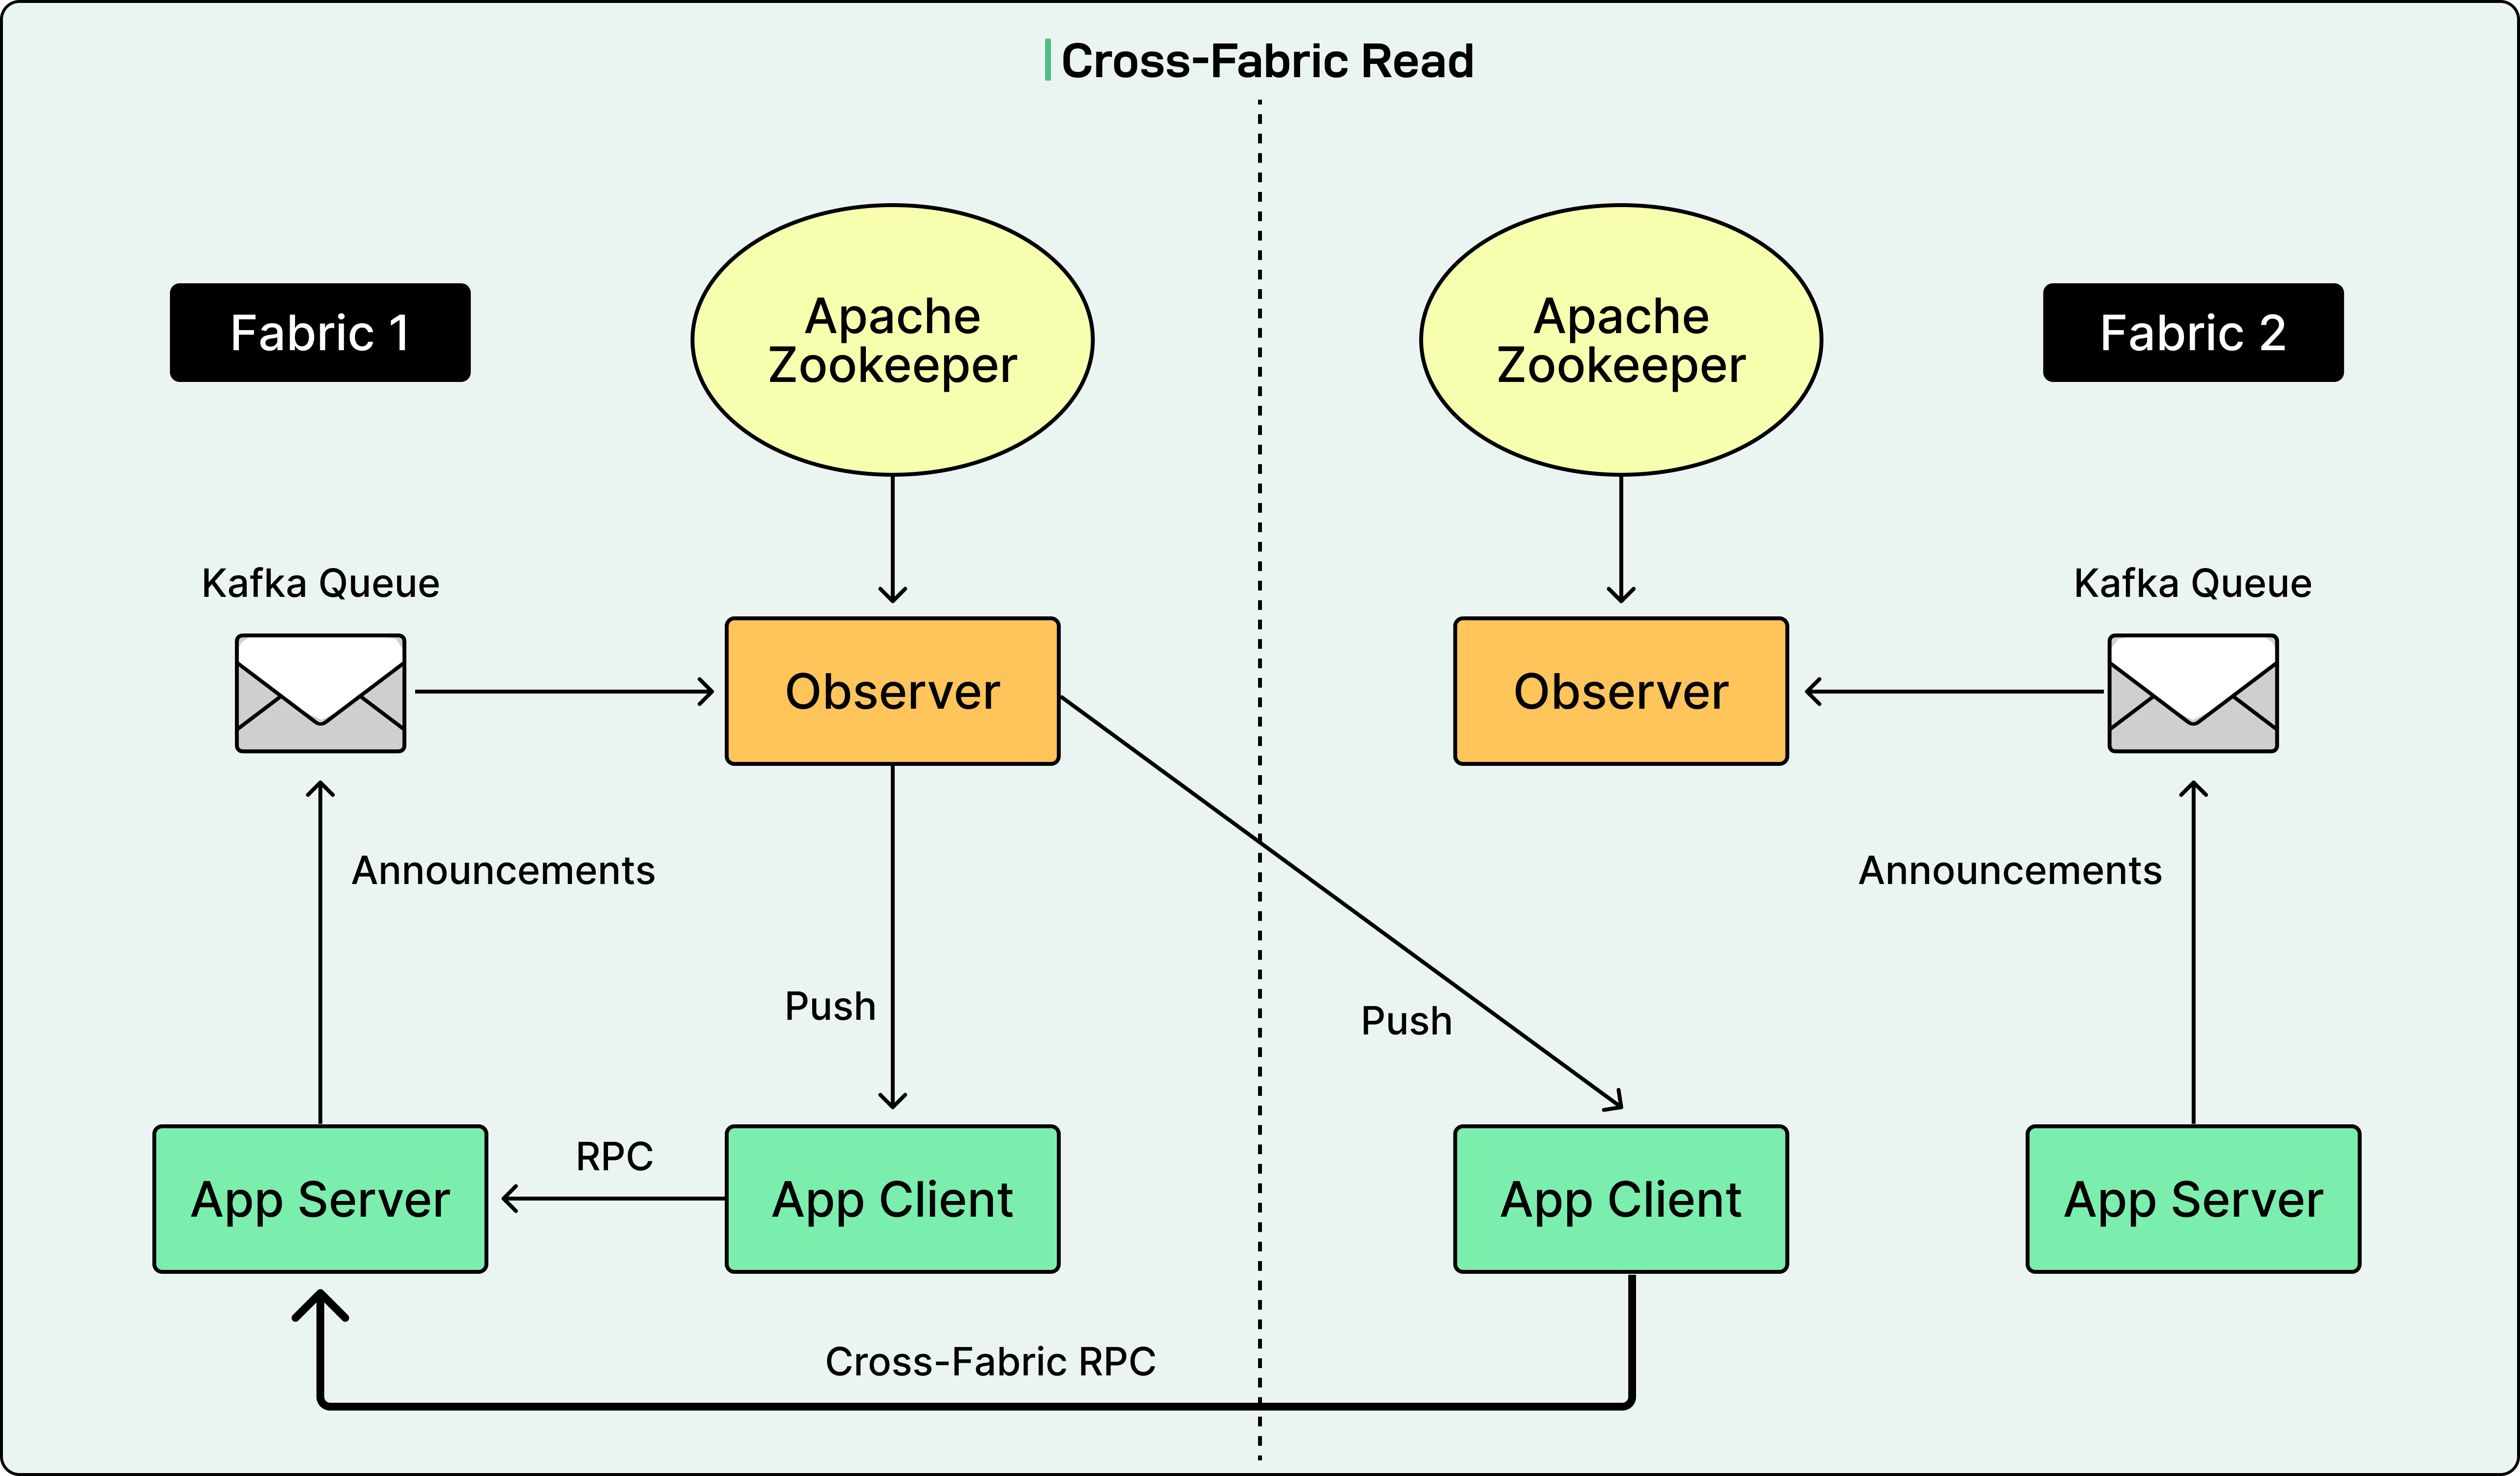
Cross-Fabric Capabilities
Next-Gen Service Discovery Observers run independently in each fabric. A fabric is a data center or isolated cluster. Application clients can be configured to connect to the Observer in a remote fabric and be served with the server applications in that fabric. This supports custom application needs or provides failover when the Observer in one fabric goes down, ensuring business traffic remains unaffected.
See the diagram below:
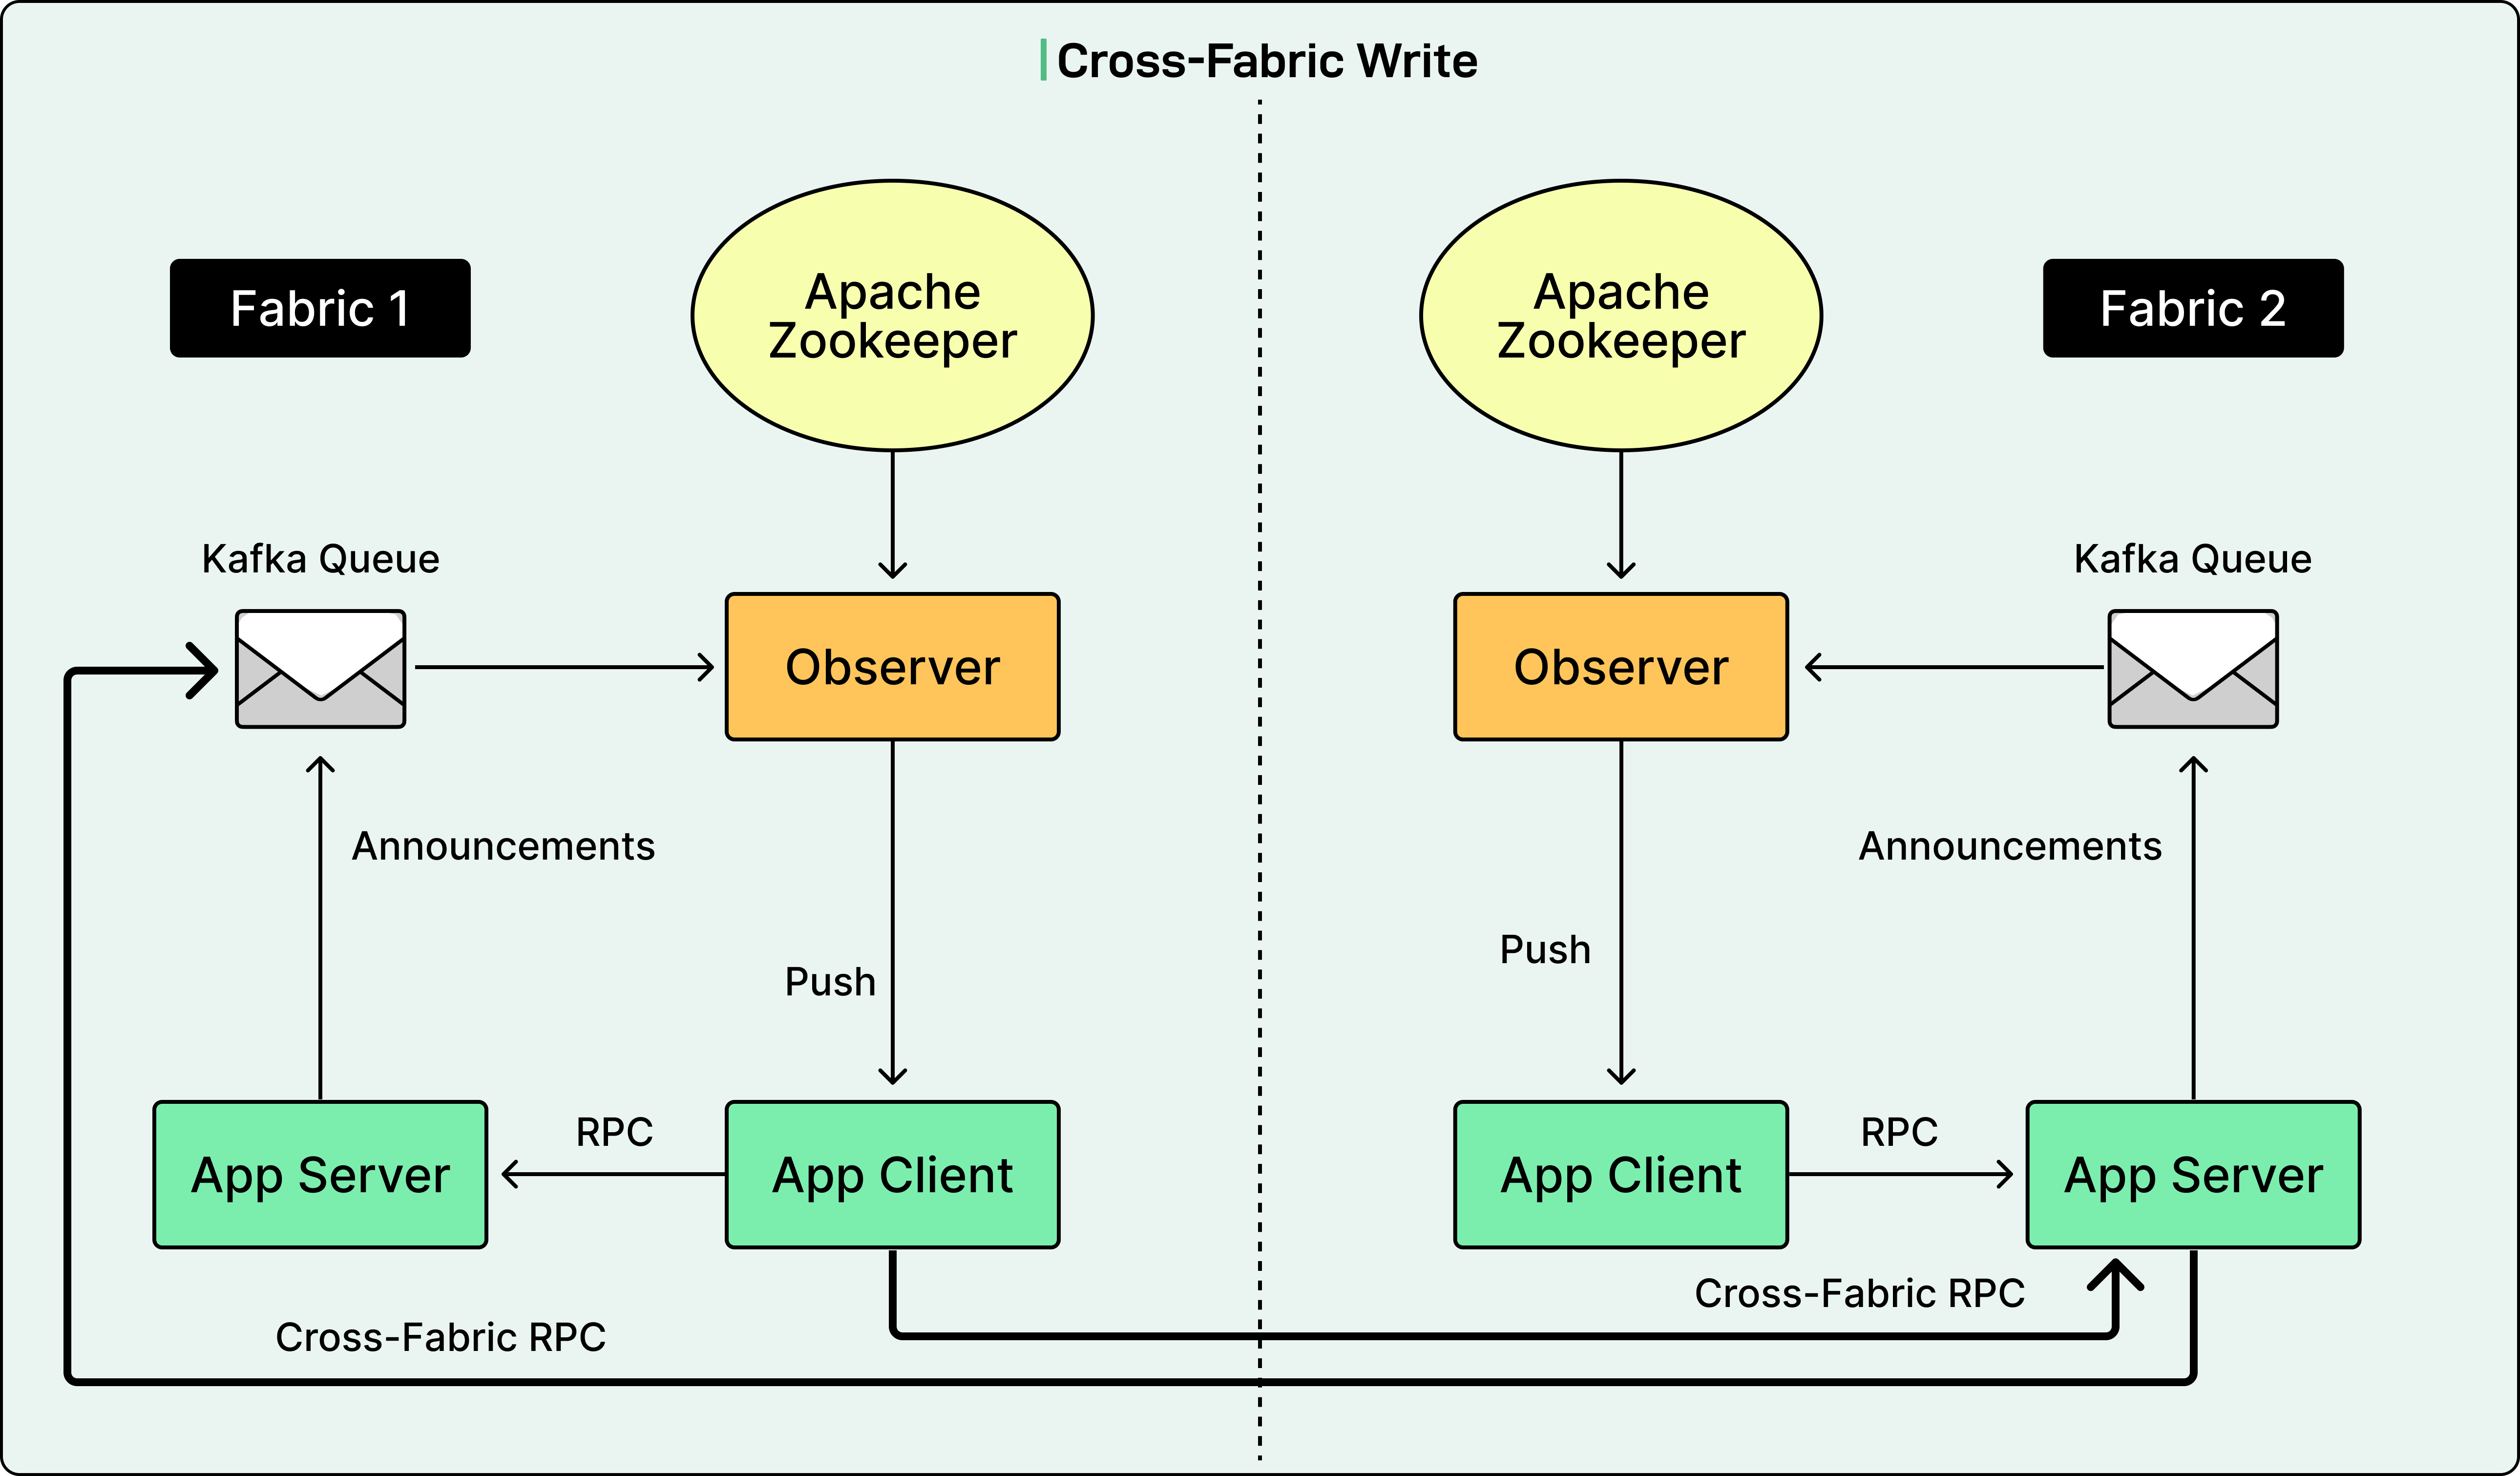
Application servers can also write to the control plane in multiple fabrics. Cross-fabric announcements are appended with a fabric name suffix to differentiate from local announcements. Application clients can then send requests to application servers in both local and remote fabrics based on preference.
See the diagram below:
The Migration Challenge
Rolling out Next-Gen Service Discovery to hundreds of thousands of hosts without impacting current requests required careful planning.
LinkedIn needed the service discovery data served by the new control plane to exactly match the data on Zookeeper. They needed to equip all application servers and clients companywide with related mechanisms through just an infrastructure library version bump. They needed central control on the infrastructure side to switch Next-Gen Service Discovery read and write on and off by application. Finally, they needed good central observability across thousands of applications on all fabrics for migration readiness, results verification, and troubleshooting.
The three major challenges were as follows:
First, service discovery is mission-critical, and any error could lead to severe site-wide incidents. Since Zookeeper was approaching capacity limits, LinkedIn needed to migrate as many applications off Zookeeper as quickly as possible.
Second, application states were complex and unpredictable. Next-Gen Service Discovery Read required client applications to establish gRPC streams. However, Rest.li applications that had existed at the company for over a decade were in very different states regarding dependencies, gRPC SSL, and network access. Compatibility with the control plane for many applications was unpredictable without actually enabling the read.
Third, read and write migrations were coupled. If the write was not migrated, no data could be read on Next-Gen Service Discovery. If the read was not migrated, data was still read on Zookeeper, blocking the write migration. Since read path connectivity was vulnerable to application-specific states, the read migration had to start first. Even after client applications migrated for reads, LinkedIn needed to determine which server applications became ready for Next-Gen Service Discovery Write and prevent clients from regressing to read Zookeeper again.
The Solution: Dual Mode Migration
LinkedIn implemented a dual mode strategy where applications run both old and new systems simultaneously, verifying the new flow behind the scenes.
To decouple read and write migration, the new control plane served a combined dataset of Kafka and Zookeeper URIs, with Kafka as the primary source and Zookeeper as backup. When no Kafka data existed, the control plane served Zookeeper data, mirroring what clients read directly from Zookeeper. This enabled read migration to start independently.
Dual Read Mode
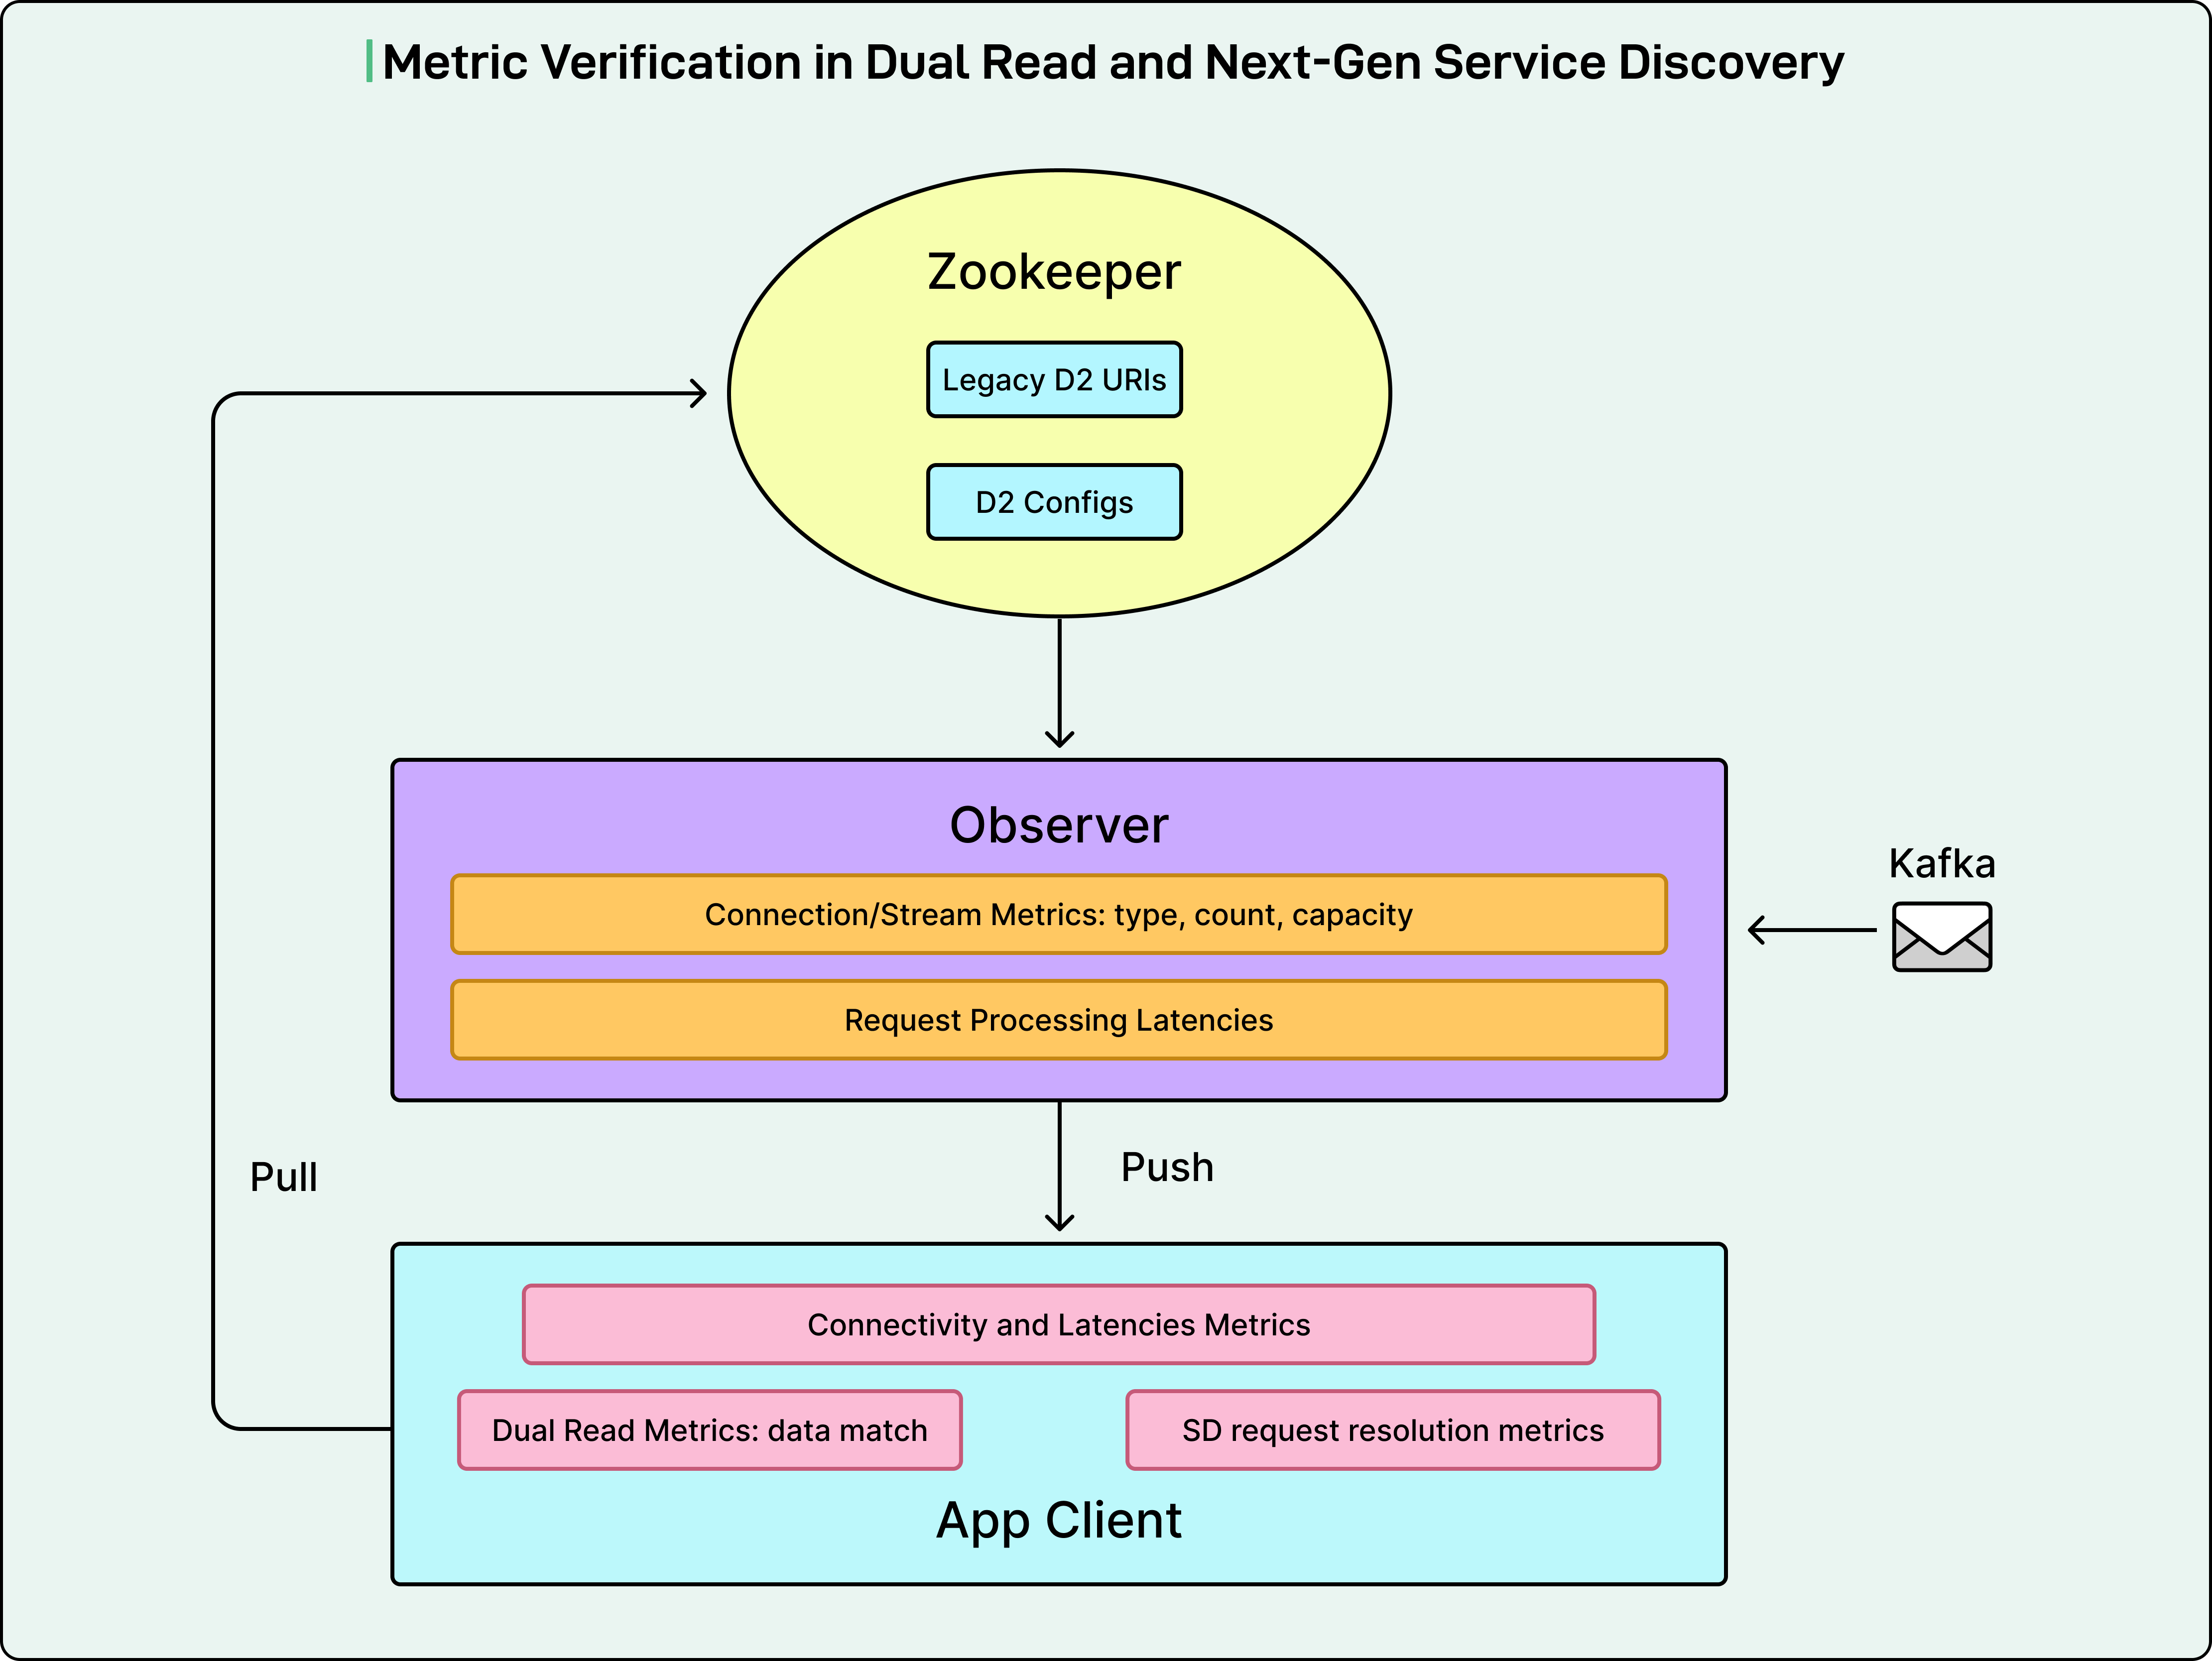
In Dual Read mode, an application client reads data from both Next-Gen Service Discovery and Zookeeper, keeping Zookeeper as the source of truth for serving traffic. Using an independent background thread, the client tried to resolve traffic as if it were served by Next-Gen Service Discovery data and reported any errors.
LinkedIn built comprehensive metrics to verify connectivity, performance, and data correctness on both the client side and Observer side. On the client side, connectivity and latency metrics watched for connection status and data latencies from when the subscription request was sent to when data was received. Dual Read metrics compared data received from Zookeeper and Next-Gen Service Discovery to identify mismatches. Service Discovery request resolution metrics showed request status, identical to Zookeeper-based metrics, but with a Next-Gen Service Discovery prefix to identify whether requests were resolved by Next-Gen Service Discovery data and catch potential errors like missing critical data.
On the Observer side, connection and stream metrics watched for client connection types, counts, and capacity. These helped identify issues like imbalanced connections and unexpected connection losses during restart. Request processing latency metrics measured time from when the Observer received a request to when the requested data was queued for sending. The actual time spent sending data over the network was excluded since problematic client hosts could get stuck receiving data and distort the metric. Additional metrics tracked Observer resource utilization, including CPU, memory, and network bandwidth.
See the diagram below:
With all these metrics and alerts, before applications actually used Next-Gen Service Discovery data, LinkedIn caught and resolved numerous issues, including connectivity problems, reconnection storms, incorrect subscription handling logic, and data inconsistencies, avoiding many companywide incidents. After all verifications passed, applications were ramped to perform Next-Gen Service Discovery read-only.
Dual Write Mode
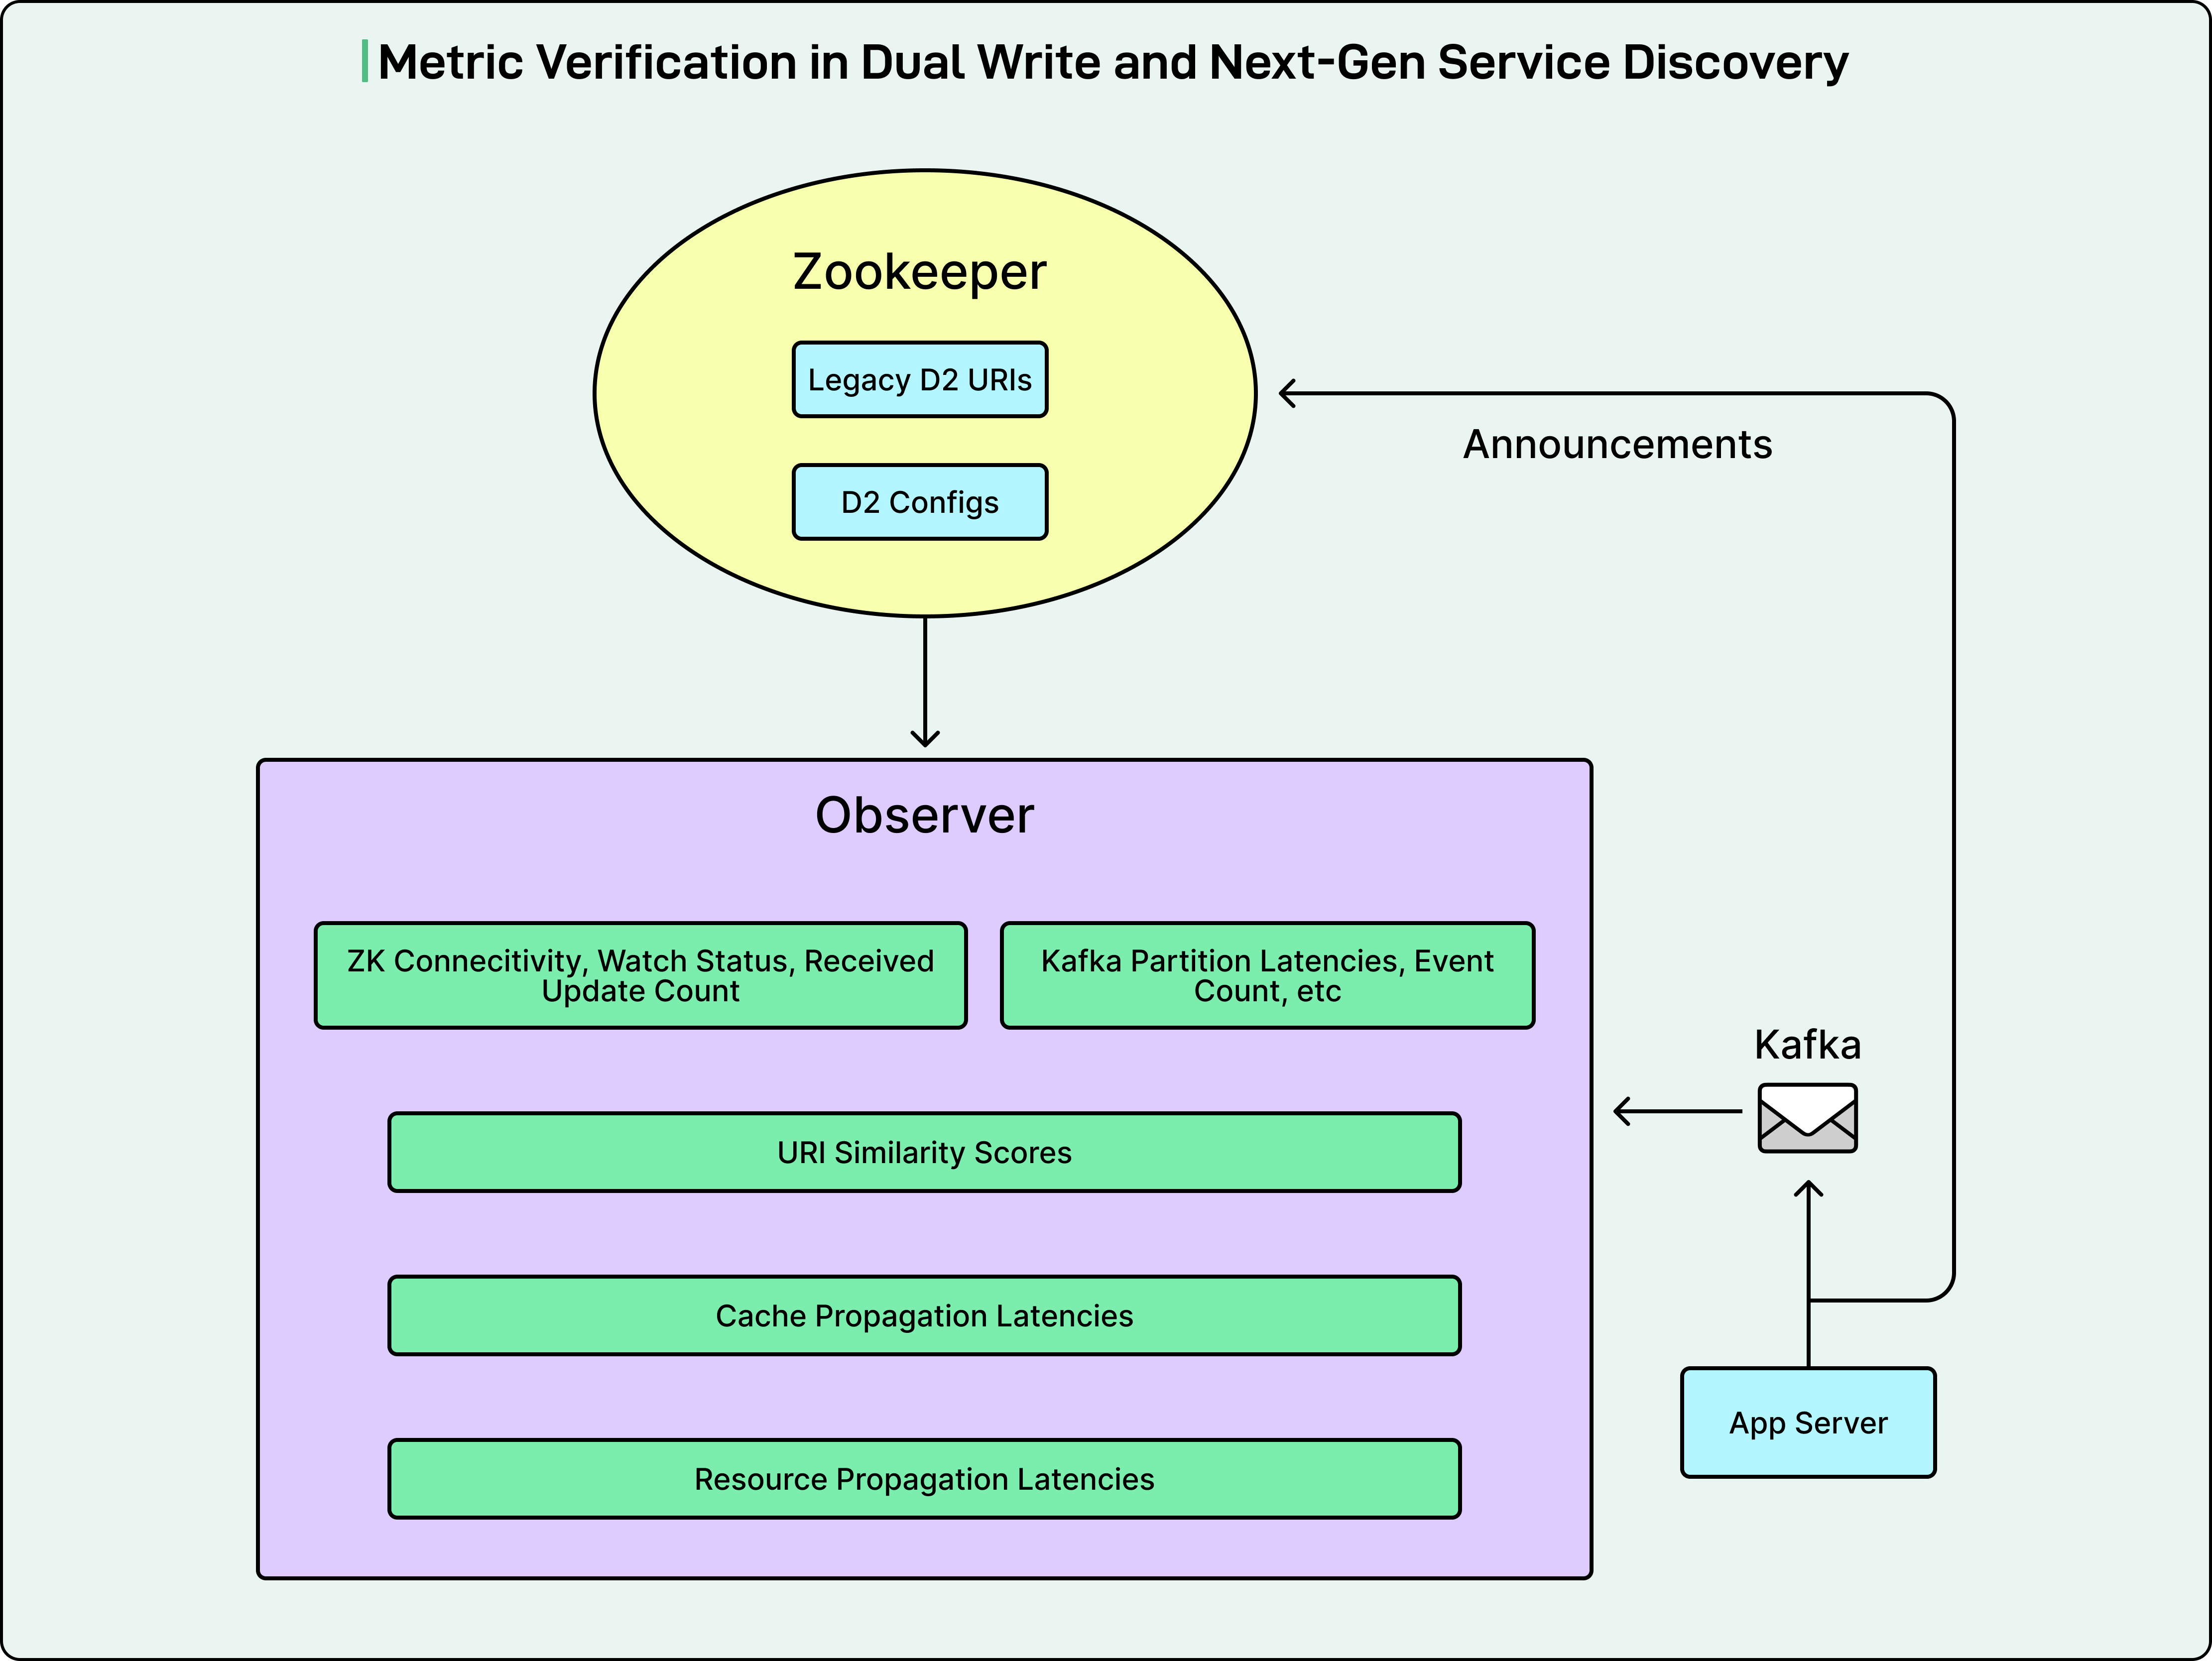
In Dual Write mode, application servers reported to both Zookeeper and Next-Gen Service Discovery.
On the Observer side, Zookeeper-related metrics monitored potential outages, connection losses, or high latencies by watching connection status, watch status, data received counts, and lags. Kafka metrics monitored potential outages and high latencies by watching partition lags and event counts.
LinkedIn calculated a URI Similarity Score for each application cluster by comparing data received from Kafka and Zookeeper. A 100 percent match could only be reached if all URIs in the application cluster were identical, guaranteeing that Kafka announcements matched existing Zookeeper announcements.
Cache propagation latency is measured as the time from when data was received on the Observer to when the Observer cache was updated.
Resource propagation latency is measured as the time from when the application server made the announcement to when the Observer cache was updated, representing the full end-to-end write latency.
On the application server side, a metric tracked the server announcement mode to accurately determine whether the server was announcing to Zookeeper only, dual write, or only Next-Gen Service Discovery. This allowed LinkedIn to understand if all instances of a server application had fully adopted a new stage.
See the diagram below:
LinkedIn also monitored end-to-end propagation latency, measuring the time from when an application server made an announcement to when a client host received the update. They built a dashboard to measure this across all client-server pairs daily, monitoring for P50 less than 1 second and P99 less than 5 seconds. P50 means that 50 percent of clients received the propagated data within that time, and P99 means 99 percent received it within that time.
Automated Dependency Analysis
The safest approach for write migration would be waiting until all client applications are migrated to Next-Gen Service Discovery Read and all Zookeeper-reading code is cleaned up before stopping Zookeeper announcements. However, with limited Zookeeper capacity and the urgency to avoid outages, LinkedIn needed to begin write migration in parallel with client application migration.
LinkedIn built cron jobs to analyze Zookeeper watchers set on the Zookeeper data of each application and list the corresponding reader applications. A watcher is a mechanism where clients register interest in data changes. When data changes, Zookeeper notifies all watchers. These jobs generated snapshots of watcher status at short intervals, catching even short-lived readers like offline jobs. The snapshots were aggregated into daily and weekly reports.
These reports identified applications with no readers on Zookeeper in the past two weeks, which LinkedIn set as the criteria for applications becoming ready to start Next-Gen Service Discovery Write. The reports also showed top blockers, meaning reader applications blocking the most server hosts from migrating, and top applications being blocked, identifying the largest applications unable to migrate, and which readers were blocking them.
This information helped LinkedIn prioritize focus on the biggest blockers for migration to Next-Gen Service Discovery Read. Additionally, the job could catch any new client that started reading server applications already migrated to Next-Gen Service Discovery Write and send alerts, allowing prompt coordination with the reader application owner for migration or troubleshooting.
Conclusion
The Next-Gen Service Discovery system achieved significant improvements over the Zookeeper-based architecture.
The system now handles the company-wide fleet of hundreds of thousands of application instances in one data center with data propagation latency of P50 less than 1 second and P99 less than 5 seconds. The previous Zookeeper-based architecture experienced high latency and unavailability incidents frequently, with data propagation latency of P50 less than 10 seconds and P99 less than 30 seconds.
This represents a tenfold improvement in median latency and a sixfold improvement in 99th percentile latency. The new system not only safeguards platform reliability at massive scale but also unlocks future innovations in centralized load balancing, service mesh integration, and cross-fabric resiliency.
Next-Gen Service Discovery marks a foundational transformation in LinkedIn’s infrastructure, changing how applications discover and communicate with each other across global data centers. By replacing the decade-old Zookeeper-based system with a Kafka and xDS-powered architecture, LinkedIn achieved near real-time data propagation, multi-language compatibility, and true horizontal scalability.
References:
great detail on the specific problems and innovative solutions...very in depth and enjoyed reading
Yeah, but, it’s LinkedIn.
I bet 10/10 readers have an account while 9/10 hate the service. Middle-out.