EP121: 9 Essential Components of a Production Microservice Application
This week’s system design interview:
Linux Crash Course - Understanding File Permissions (Youtube video)
9 Essential Components of a Production Microservice Application
Iterative, Agile, Waterfall, Spiral Model, RAD Model... What are the differences?
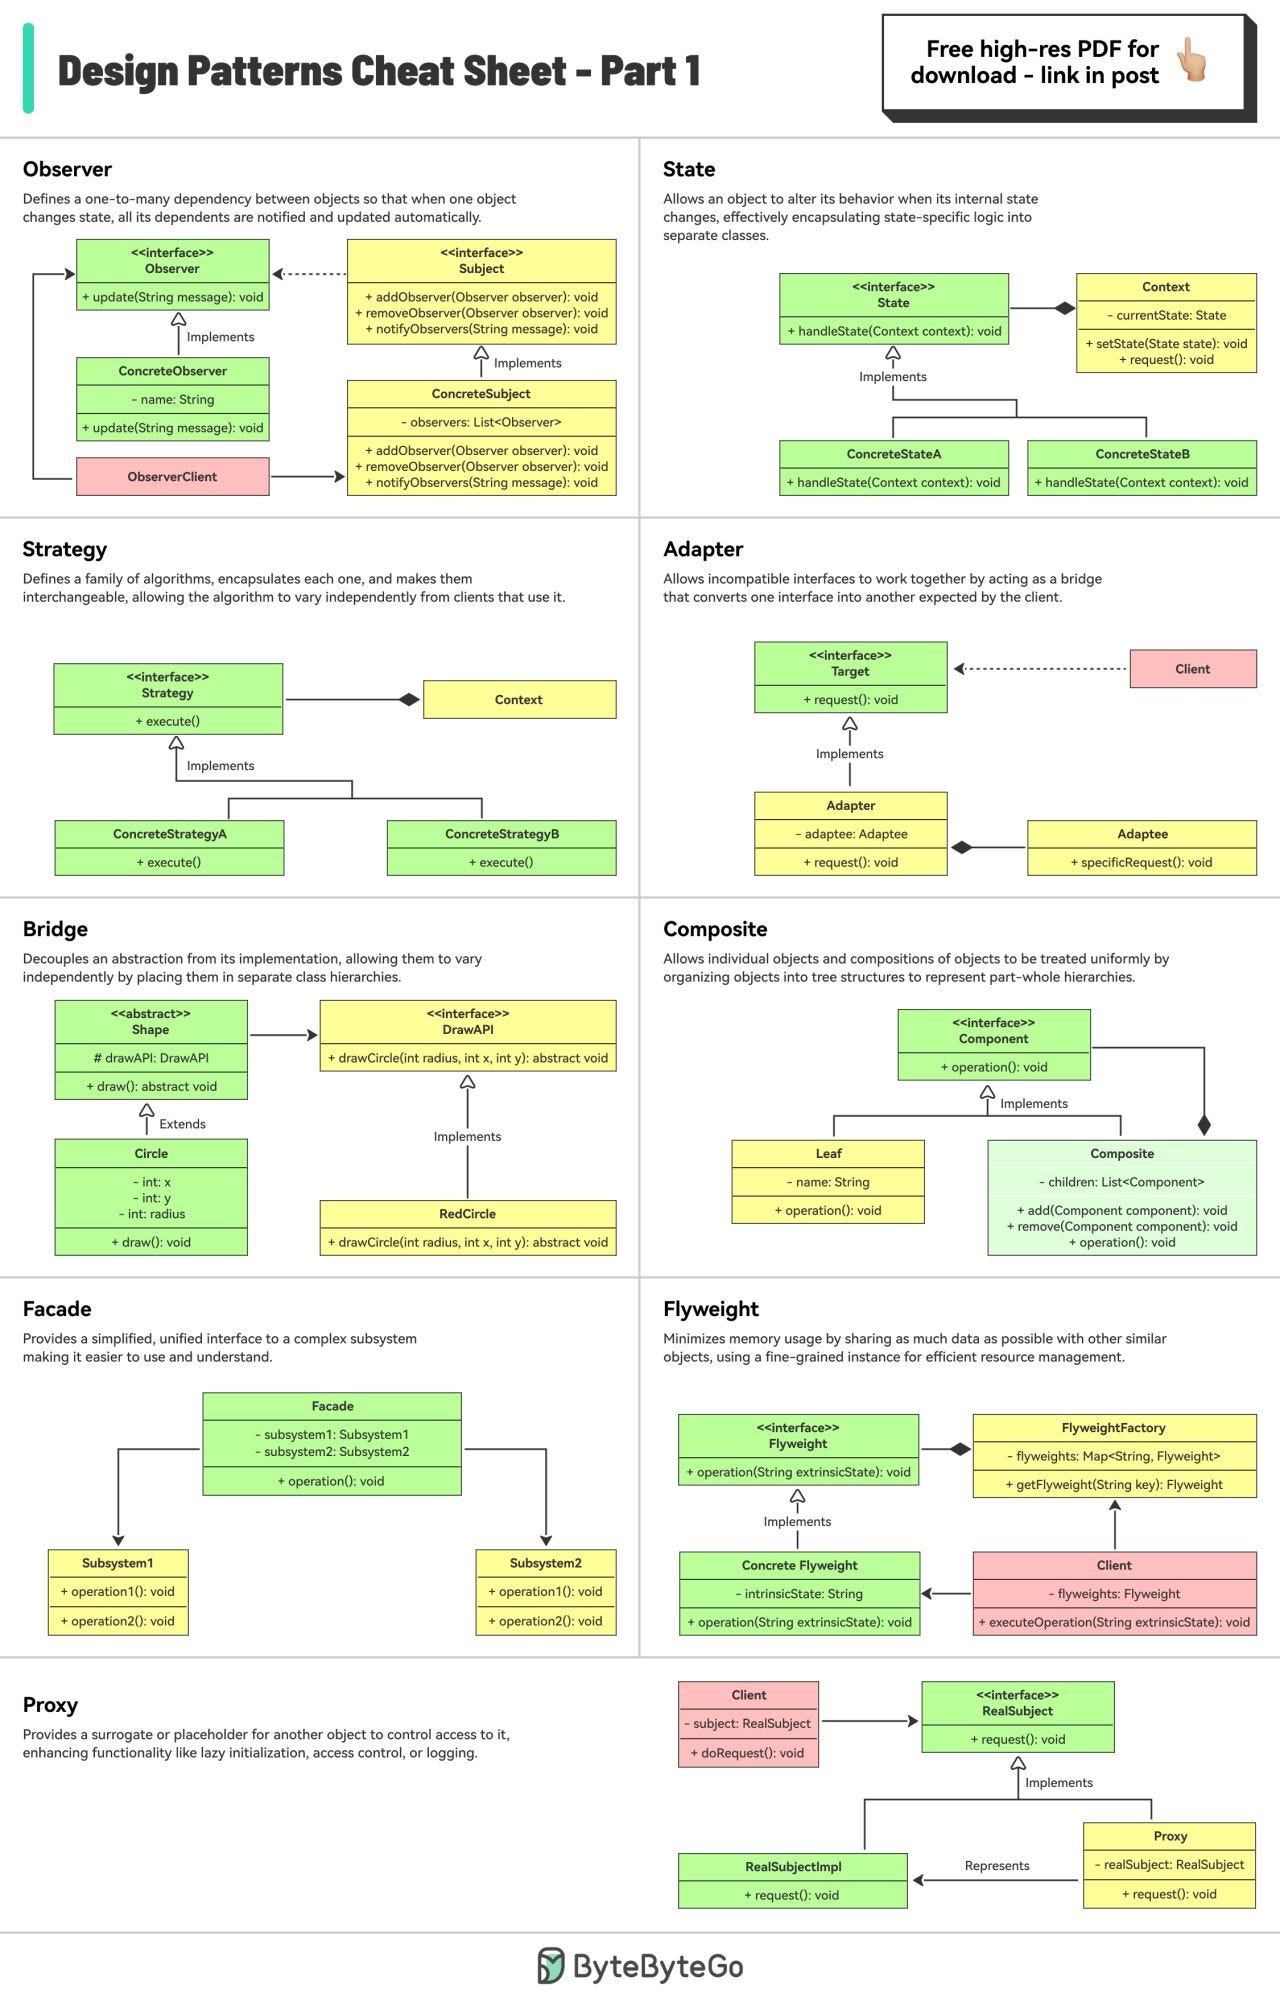
Design Patterns Cheat Sheet - Part 1 and Part 2
SPONSOR US
✂️Cut your QA cycles down to minutes with automated testing (Sponsored)
Are slow test cycles bottlenecking your dev teams’ release velocity? With QA Wolf, your organization can run entire test suites in minutes for faster feedback and developer confidence to ship.
QA Wolf takes testing off your plate. They can get you:
80% automated test coverage in weeks—not years
24-hour maintenance and on-demand test creation
Zero flakes, guaranteed
The benefit? No more manual E2E testing. No more slow QA cycles. No more bugs reaching production.
With QA Wolf, Drata’s team of 80+ engineers achieved 4x more test cases and 86% faster QA cycles.
🌟Rated 4.8/5 on G2
Linux Crash Course - Understanding File Permissions
9 Essential Components of a Production Microservice Application
API Gateway
The gateway provides a unified entry point for client applications. It handles routing, filtering, and load balancing.Service Registry
The service registry contains the details of all the services. The gateway discovers the service using the registry. For example, Consul, Eureka, Zookeeper, etc.Service Layer
Each microservices serves a specific business function and can run on multiple instances. These services can be built using frameworks like Spring Boot, NestJS, etc.Authorization Server
Used to secure the microservices and manage identity and access control. Tools like Keycloak, Azure AD, and Okta can help over here.Data Storage
Databases like PostgreSQL and MySQL can store application data generated by the services.Distributed Caching
Caching is a great approach for boosting the application performance. Options include caching solutions like Redis, Couchbase, Memcached, etc.Async Microservices Communication
Use platforms such as Kafka and RabbitMQ to support async communication between microservices.Metrics Visualization
Microservices can be configured to publish metrics to Prometheus and tools like Grafana can help visualize the metrics.Log Aggregation and Visualization
Logs generated by the services are aggregated using Logstash, stored in Elasticsearch, and visualized with Kibana.
Over to you: What else would you add to your production microservice architecture?
Latest articles
If you’re not a paid subscriber, here’s what you missed.
To receive all the full articles and support ByteByteGo, consider subscribing:
Iterative, Agile, Waterfall, Spiral Model, RAD Model... What are the differences?
The Software Development Life Cycle (SDLC) is a framework that outlines the process of developing software in a systematic way. Here are some of the most common ones:
Waterfall Model:
- A linear and sequential approach.
- Divides the project into distinct phases: Requirements, Design, Implementation, Verification, and Maintenance.Agile Model:
- Development is done in small, manageable increments called sprints.
- Common Agile methodologies include Scrum, Kanban, and Extreme Programming (XP).V-Model (Validation and Verification Model):
- An extension of the Waterfall model.
- Each development phase is associated with a testing phase, forming a V shape.Iterative Model:
- Focuses on building a system incrementally.
- Each iteration builds upon the previous one until the final product is achieved.Spiral Model:
- Combines iterative development with systematic aspects of the Waterfall model.
- Each cycle involves planning, risk analysis, engineering, and evaluation.Big Bang Model:
- All coding is done with minimal planning, and the entire software is integrated and tested at once.RAD Model (Rapid Application Development):
- Emphasizes rapid prototyping and quick feedback.
- Focuses on quick development and delivery.Incremental Model:
- The product is designed, implemented, and tested incrementally until the product is finished.
Each of these models has its advantages and disadvantages, and the choice of which to use often depends on the specific requirements and constraints of the project at hand.
Design Patterns Cheat Sheet - Part 1 and Part 2
The cheat sheet briefly explains each pattern and how to use it.
What's included?
Factory
Builder
Prototype
Singleton
Chain of Responsibility
And many more!
SPONSOR US
Get your product in front of more than 1,000,000 tech professionals.
Our newsletter puts your products and services directly in front of an audience that matters - hundreds of thousands of engineering leaders and senior engineers - who have influence over significant tech decisions and big purchases.
Space Fills Up Fast - Reserve Today
Ad spots typically sell out about 4 weeks in advance. To ensure your ad reaches this influential audience, reserve your space now by emailing hi@bytebytego.com


How to design these diagrams
Great diagram about the Microservices application architecture at https://blog.bytebytego.com/i/146792961/essential-components-of-a-production-microservice-application.
In my opinion this architecture is also valid for most of the software these days. Not just microservices, but also web applications, distributed monolith and so on. Think Spotify, Netflix, Your bank web application and pretty much everything.
I believe also it deserves some extra discussion about the logs and metric collection.
- Pushing logs to Logstash (which seems to be suggested by the direction of the arrows) was the recommended way until a combination of Kubernetes cluster monitoring and Elastic Agent changed the paradigm for good few years ago. Logs are now written by the application running on K8s to local files on the k8s nodes and can be easily collected by Elastic Agents running on each K8s node and pushed directly to Elasticsearch. Logstash has almost become obsolete, except for some very specific use cases. Doing log aggregation this way has tremendous benefits for the application since it doesn't need to deal with pushing logs directly to Logstash, retries or other Logstash failures.
- Similarly to the point above. Applications exposes Prometheus-format metrics at a HTTP endpoints, Prometheus collects those metrics (aka it pulls from that endpoint) and pushes them to its storage.
- Actually Prometheus can be taken out of the picture as well as Logstash, since Elastic Agent can collect Prometheus-format metrics directly from the applications and push them to Elasticsearch.
Why should you trust me on what I said above?
I have worked for 2 years at Elastic in the cloud-native monitoring team and I have seen countless customers implement that exact pattern.
I'm still at Elastic but in a different department.
This week article on my newsletter Cloud Native Engineer will discuss in detail logs collection in Kubernetes with Elastic Agent.