Cloudflare’s Trillion-Message Kafka Infrastructure: A Deep Dive
Disclaimer: The content (text and diagrams) in this post has been derived and compiled from the fantastic articles originally published on the Cloudflare Tech Blog by Matt Boyle, Andrea Medda, and Chris Shepherd. All credit for the details covered here goes to them. The links to the exact articles are in the references section at the end of the post. If you find any inaccuracies or omissions, please leave a comment, and we will do our best to fix them.
How much is 1 trillion?
If you were to start counting one number per second, it would take you over 31000 years to reach 1 trillion.
Now, imagine processing 1 trillion messages. This is the incredible milestone Cloudflare’s Kafka infrastructure achieved recently.
Cloudflare’s vision is to build a better Internet by providing a global network. They enable customers to secure and accelerate their websites, APIs, and applications.
However, as Cloudflare’s customer base grew rapidly, they needed to handle massive volumes of data and traffic while maintaining high availability and performance. Both scale and resilience were significant for their Kafka infrastructure.
Cloudflare has been using Kafka in production since 2014. They currently run 14 distinct Kafka clusters with roughly 330 nodes spread over multiple data centers.
In this article, we will explore the challenges solved and lessons learned by Cloudflare’s engineering team in their journey of scaling Kafka.
The Early Days
In the early days of Cloudflare, their architecture was built around a monolithic PHP application.
While this approach worked well initially, it created challenges as their product offerings grew. With numerous teams contributing to the same codebase, the monolithic architecture started to impact Cloudflare's ability to deliver features and updates safely and efficiently.
A couple of major issues were as follows:
There was a tight coupling between services. Any change had a significant impact radius and required a lot of coordination between teams.
It was difficult to implement retry mechanisms to handle scenarios when something went wrong.
To address these challenges, Cloudflare turned to Apache Kafka as a solution for decoupling services and enabling retry mechanisms.
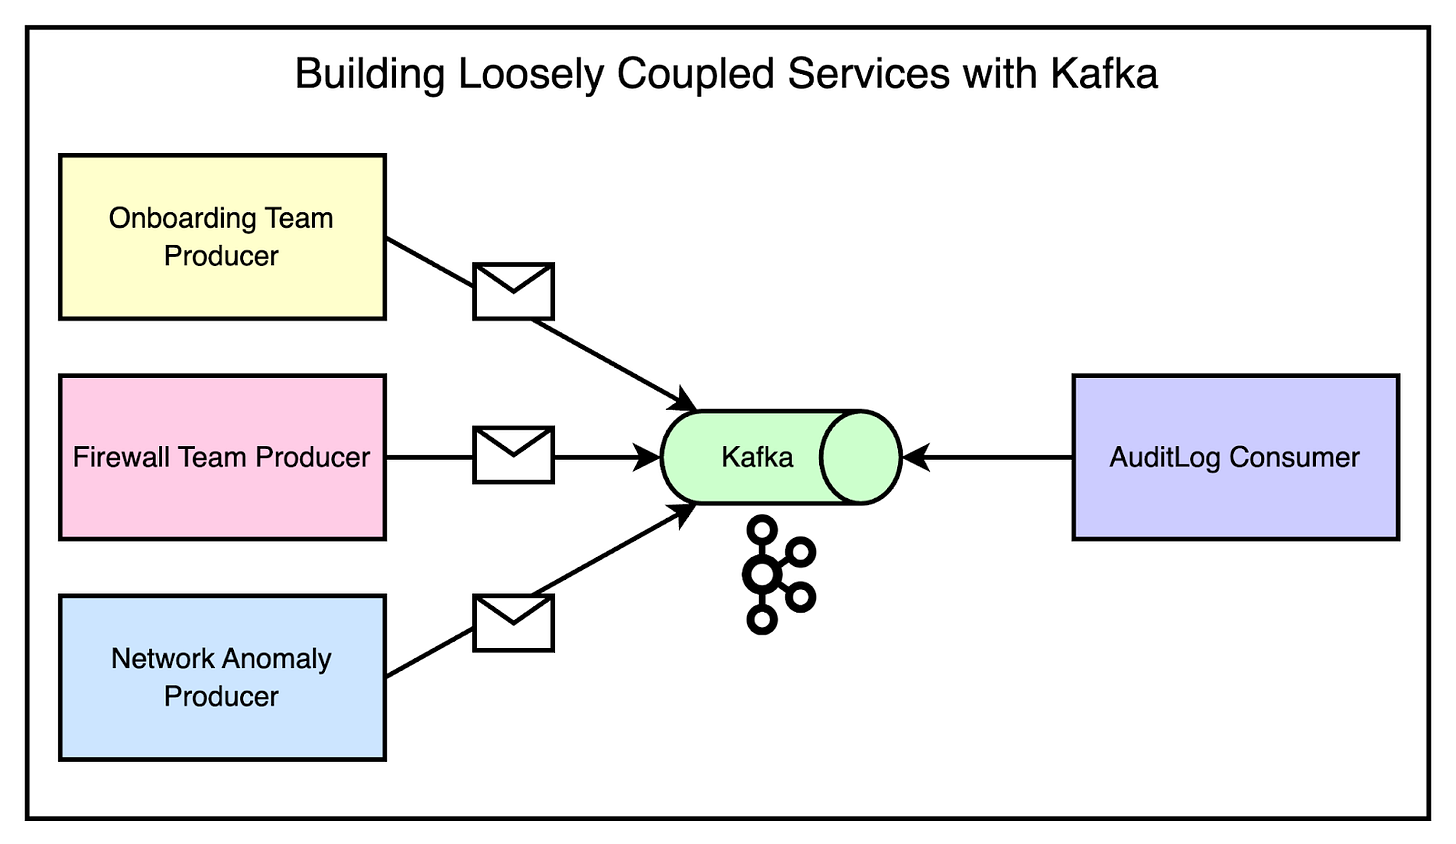
See the diagram below that demonstrates this scenario.

As you can notice, if multiple teams needed to emit messages that the audit log system was interested in, they could simply produce messages for the appropriate topics.
The audit log system could then consume from those topics without any direct coupling to the producing services. Adding a new service that needed to emit audit logs was as simple as producing for the right topics, without requiring any changes to the consuming side.
Kafka, a distributed streaming platform, had already proven its ability to handle massive volumes of data within Cloudflare's infrastructure.
As a first step, they created a message bus cluster on top of Kafka. It became the most general-purpose cluster available to all application teams at Cloudflare.
Onboarding to the cluster was made simple through a pull request process, which automatically set up topics with the desired replication strategy, retention period, and access control lists (ACLs).
The impact of the message bus cluster on loose coupling was evident.
Teams could now emit messages to topics without being aware of the specific services consuming those messages.
Consuming services could listen to relevant topics without needing to know the details of the producing services.
There was greater flexibility and independence among teams.
Standardizing Communication
As Cloudflare’s architecture evolved towards a decoupled and event-driven system, a new challenge emerged: unstructured communication between services.
There was no well-defined contract for message formats, leading to issues.
A common pitfall was the lack of agreement on message structure. For example, a producer might send a JSON blob with certain expected keys, but if the consumer wasn’t aware of this expectation, it could lead to unprocessable messages and tight coupling between services.
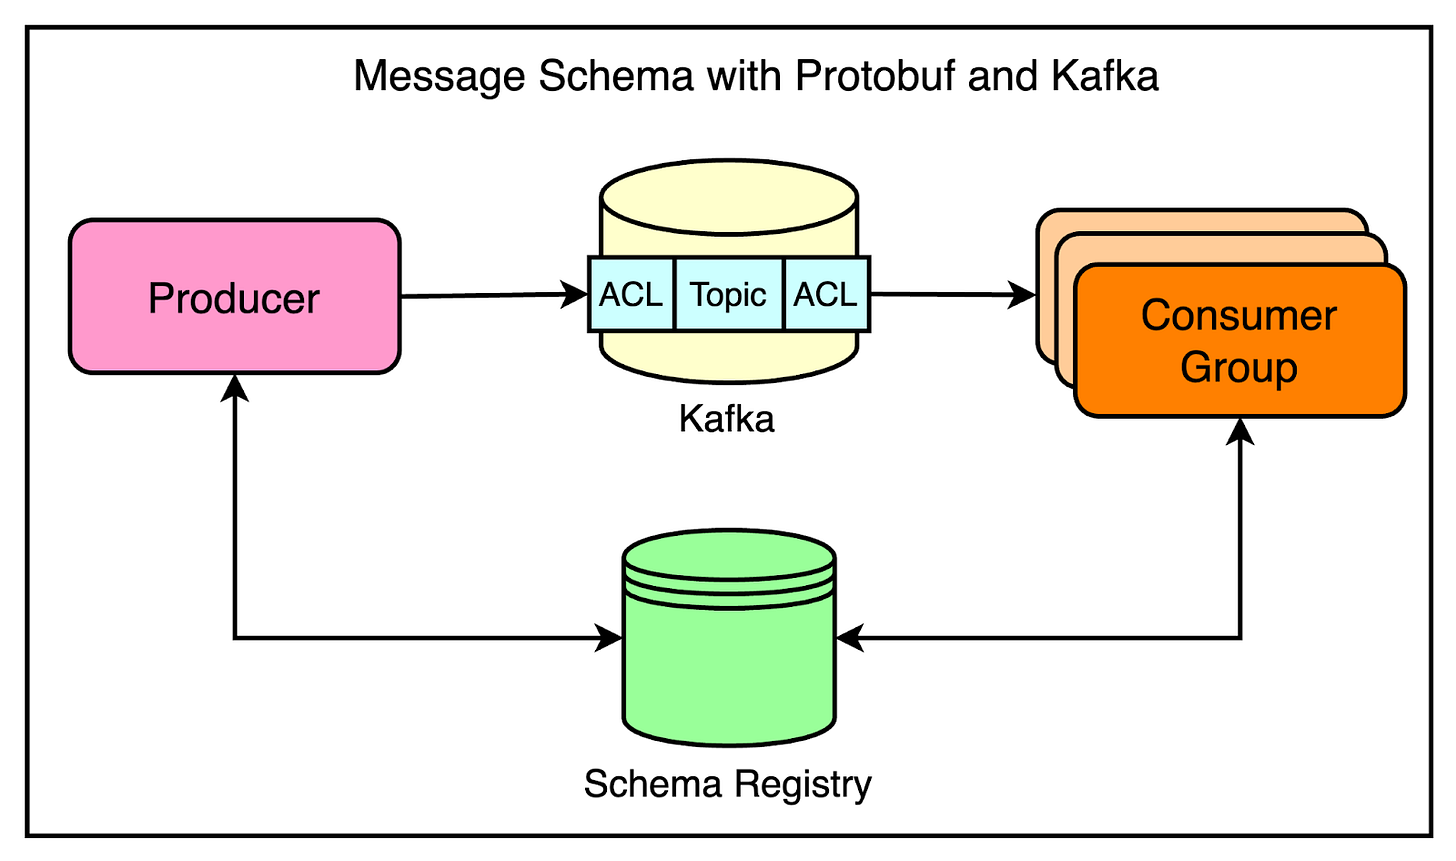
To address this challenge, Cloudflare turned to Protocol Buffers (Protobuf) as a solution for enforcing message contracts.
Protobuf, developed by Google, is a language-agnostic data serialization format that allows for defining strict message types and schemas.

It provided several benefits such as:
Producers and consumers could have a shared understanding of message structures using a schema registry.
Since Protobuf supports versioning and schema evolution, it was possible to make changes to message formats without breaking existing consumers. This enabled both forward and backward compatibility.
Protobuf’s compact binary format results in smaller message sizes compared to JSON, improving efficiency.
To streamline Kafka usage and enforce best practices, Cloudflare developed an internal message bus client library in Go. This library handled the complexities of configuring Kafka producers and consumers. All the best practices and opinionated defaults were baked into this library.
There was one controversial decision at this point.
The message bus client library enforced a one-to-one mapping between Protobuf message types and Kafka topics. This meant that each topic could only contain messages of a single Protobuf type. The idea was to avoid the confusion and complexity of handling multiple message formats within a single topic.

There was a major trade-off to consider.
The strict one-to-one mapping between message types and topics resulted in a larger number of topics, partitions, and replicas while impacting resource utilization. On the other side, it also improved the developer experience, reduced coupling, and increased reliability.
Latest articles
If you’re not a paid subscriber, here’s what you missed.
To receive all the full articles and support ByteByteGo, consider subscribing:
Abstracting Common Patterns
As Cloudflare’s adoption of Kafka grew and more teams started leveraging the message bus client library, a new pattern emerged.
Teams were using Kafka for similar styles of jobs. For example, many teams were building services that read data from one system of record and pushed it to another system, such as Kafka or Cloudflare edge database called Quicksilver. These services often involved similar configurations and boilerplate code.
There were a couple of problems such as:
Duplicated efforts across teams.
Following best practices was harder.
To address this, the application services team developed the connector framework.
Inspired by Kafka connectors, the framework allows engineers to quickly spin up services that can read from one system and push data to another with minimal configuration. The framework abstracts away the common patterns and makes it easy to build data synchronization pipelines.
The diagram below shows a high-level view of the connector approach.

Using the connector framework is straightforward.
The developers use a CLI tool to generate a ready-to-go service by providing just a few parameters.
The generated service includes all the necessary components, such as a reader, a writer, and optional transformations.
To configure the connector, you just need to tweak the environment variables, eliminating the need for code changes in most cases. For example, developers can specify the reader (let’s say, Kafka), the writer (let’s say Quicksilver), and any transformations using environment variables. The framework takes care of the rest.
Here’s a more concrete example of how the connector framework is used in Cloudflare’s communication preferences service.

The communication preferences service allows customers to opt out of marketing information through the Cloudflare dashboard. When a customer updates their communication preferences, the service stores the change in its database and emits a message to Kafka.
To keep other systems in sync with the communication preferences, the team leverages the connector framework. They have set up three different connectors that read the communication preference changes from Kafka and synchronize them to three separate systems such as:
Transactional email service
Customer management system
Marketing email system
Scaling Challenges and Solutions
Cloudflare faced multiple scaling challenges with its Kafka adoption. Let’s look at a few of the major ones and how the team solved those challenges.
1 - Visibility
When Cloudflare experienced a surge in internet usage and customer growth during the pandemic, the audit logs system faced a lot of challenges in keeping up with the increased traffic.
Audit logs are a crucial feature for customers to track changes to their resources, such as the deletion of a website or modifications to security settings. As more customers relied on Cloudflare’s services, the audit logs systems struggled to process the growing volume of events on time.
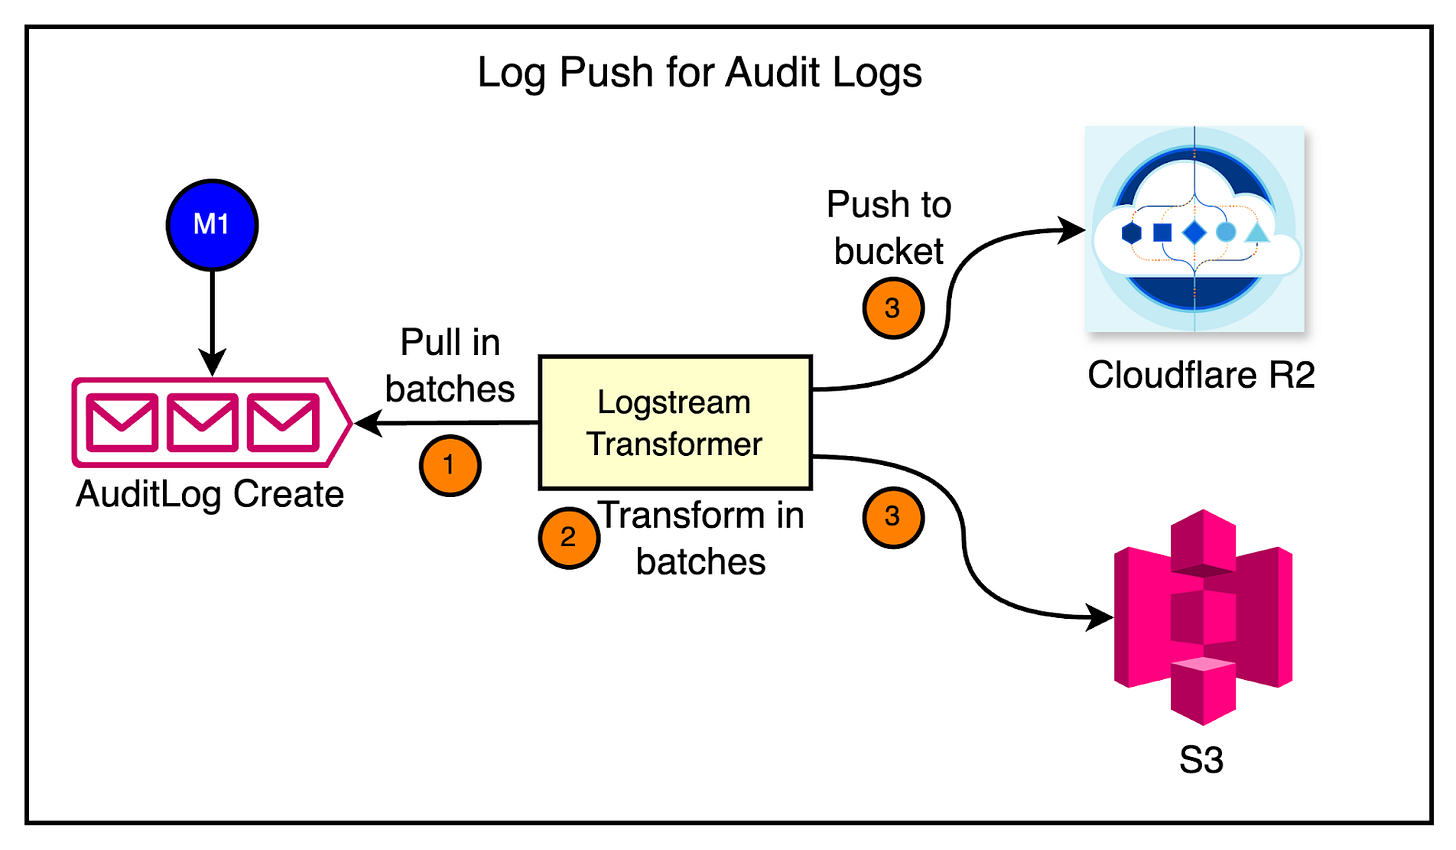
As a first fix, the team invested in a pipeline that pushes audit log events directly into customer data buckets, such as R2 or S3.
See the diagram below:

However, when the pipeline was deployed to production, they encountered multiple issues.
The system was accruing logs and failing to clear them fast enough.
Breaches in service level objectives (SLOs).
Unacceptable delays in delivering audit log data to customers.
Initially, the team lacked the necessary tooling in their SDK to understand the root cause of the performance issues. They couldn’t determine whether the bottleneck was in reading from Kafka, performing transformations, or saving data to the database.
To gain visibility, they enhanced their SDK with Prometheus metrics, specifically using histograms to measure the duration of each step in the message processing flow. They also explored OpenTelemetry, a collection of SDKs and APIs that made it easy to collect metrics across services written in different programming languages.
With better visibility provided by Prometheus and OpenTelemetry, the team could identify the longest-running parts of the pipeline. Both reading from Kafka and pushing data to the bucket were slow.
By making targeted improvements, they were able to reduce the lag and ensure that audit logs were delivered to customers on time, even at high throughput rates of 250 to 500 messages per second.
2 - Noisy On-call
One thing leads to another.
Adding metrics to the Kafka SDK provided valuable insights into the health of the cluster and the services using it. However, it also led to a new challenge: a noisy on-call experience.
The teams started receiving frequent alerts related to unhealthy applications unable to reach the Kafka brokers. There were also alerts about lag issues and general Kafka cluster health problems.
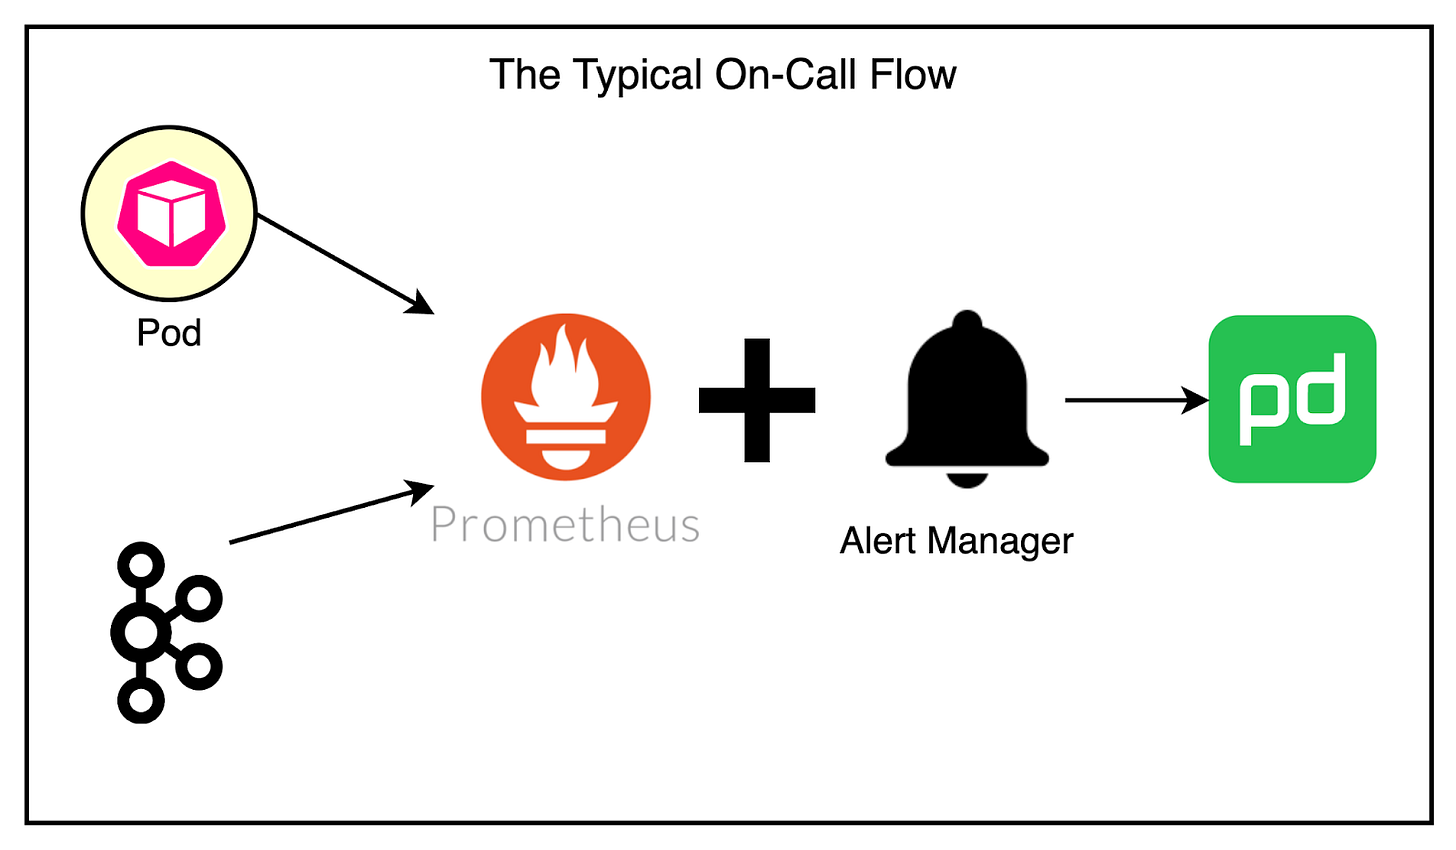
The existing alerting pipeline was fairly basic. Prometheus collected the metrics and AlertManager continuously monitored them to page the team via PagerDuty.

Most problems faced by services concerning Kafka were due to deteriorating network conditions. The common solution was to restart the service manually. However, this often required on-call engineers to wake up during the night to perform manual restarts or scale services up and down, which was far from ideal.
To address this challenge, the team decided to leverage Kubernetes and their existing knowledge to improve the situation. They introduced health checks.
Health checks allow applications to report their readiness to operate, enabling the orchestrator to take appropriate actions when issues arise.
In Kubernetes, there are three types of health checks:
Liveness Probe: They indicate whether a service is ready to run.
Readiness Probe: They determine if a service is prepared to receive HTTP traffic.
Startup Probes: They act as an extended liveness check for slow-starting services.
Kubernetes periodically pings the service at a specific endpoint (example: /health), and the service must respond with a successful status code to be considered healthy.
For Kafka consumers, implementing a readiness probe doesn’t make much sense, as they typically don’t expose an HTTP server. Therefore, the team focused on implementing simple liveness checks that worked as follows:
Perform a basic operation with the Kafka broker, such as listing topics.
If the operation fails, the health check fails, indicating an issue with the service’s ability to communicate with the broker.
The diagram below shows the approach:

There were still cases where the application appeared healthy but was stuck and unable to produce or consume messages. To handle this, the team implemented smarter health checks for Kafka consumers.
The smart health checks rely on two key concepts:
The current offset represents the last available offset on a partition.
The committed offset is the last offset committed by a specific consumer for that partition.
Here’s what happens during the health check:
The consumer retrieves both offsets.
If it fails to retrieve them, the consumer is considered unhealthy.
If the offsets are successfully retrieved, the consumer compares the last committed offset with the current offset.
If they are the same, no new messages have been appended to the partition, and the consumer is considered healthy.
If the last committed offset hasn’t changed since the previous check, the consumer is likely stuck and needs to be restarted.
Implementing these smart health checks led to improvements in the on-call experience as well as overall customer satisfaction.
3 - Inability to Keep Up
Another challenge that sprang up as Cloudflare’s customer base grew was with the email system.
The email system is responsible for sending transactional emails to customers, such as account verification emails, password reset emails, and billing notifications. These emails were critical for customer engagement and satisfaction, and any delays or failures in delivering them can hurt the user experience.
During traffic spikes, the email system struggled to process the high volume of messages being produced to Kafka.
The system was designed to consume messages one at a time, process them, and send the corresponding emails. However, as the production rate increased, the email system fell behind, creating a growing backlog of messages and increased lag.
One thing was clear to the engineering team at Cloudflare. The existing architecture wasn’t scalable enough to handle the increasing production rates.
Therefore, they introduced batch consumption to optimize the email system’s throughput.
Batch consumption is a technique where instead of processing messages one at a time, the consumer retrieves a batch of messages from Kafka and processes them together. This approach has several advantages, particularly in scenarios with high production rates.
The diagram below shows the batching approach.

The changes made were as follows:
The Kafka consumer was modified to retrieve a configurable number of messages in each poll.
They updated the email-sending logic to process the batch of messages. Techniques like bulk database inserts and parallel email dispatching were used.
Batch consuming with emails was soon put to the test during a major product launch that generated a surge in sign-ups and account activations.
This resulted in a massive increase in the number of account verification emails that had to be sent. However, the email system was able to handle the increased load efficiently.
Conclusion
Cloudflare’s journey of scaling Kafka to handle 1 trillion messages is remarkable.
From the early days of their monolithic architecture to the development of sophisticated abstractions and tools, we’ve seen how Cloudflare tackled multiple challenges across coupling, unstructured communication, and common usage patterns.
Along the way, we’ve also learned valuable lessons that can be applied to any organization. Here are a few of them:
It’s important to strike a balance between configuration and simplicity. While flexibility is necessary for diverse use cases, it’s equally important to standardize and enforce best practices.
Visibility is the key in distributed systems. If you can’t see what’s happening in a certain part of your application, it becomes hard to remove bottlenecks.
Clear and well-defined contracts between producers and consumers are essential for building loosely coupled systems that can evolve independently.
Sharing knowledge and best practices across the organization helps streamline the adoption process and creates opportunities for improvement.
References:
SPONSOR US
Get your product in front of more than 500,000 tech professionals.
Our newsletter puts your products and services directly in front of an audience that matters - hundreds of thousands of engineering leaders and senior engineers - who have influence over significant tech decisions and big purchases.
Space Fills Up Fast - Reserve Today
Ad spots typically sell out about 4 weeks in advance. To ensure your ad reaches this influential audience, reserve your space now by emailing hi@bytebytego.com


I'd say a lot of details are missing that might make this article a lot more informative:
- how does it work in multi-region environment?
- trillion messages per hour / day / week?
- what's used as a schema registry?
- how do they handle "exactly once" delivery for emails sending?
- do they have any patches on top of the mainstream version?
- is replication used at all?
- how many boxes are used and what configurations do they find optimal?
Etc etc
How should we read trillion message count? Is it a rate of message ingestion? Or is it total messages that are stored in Kafka?